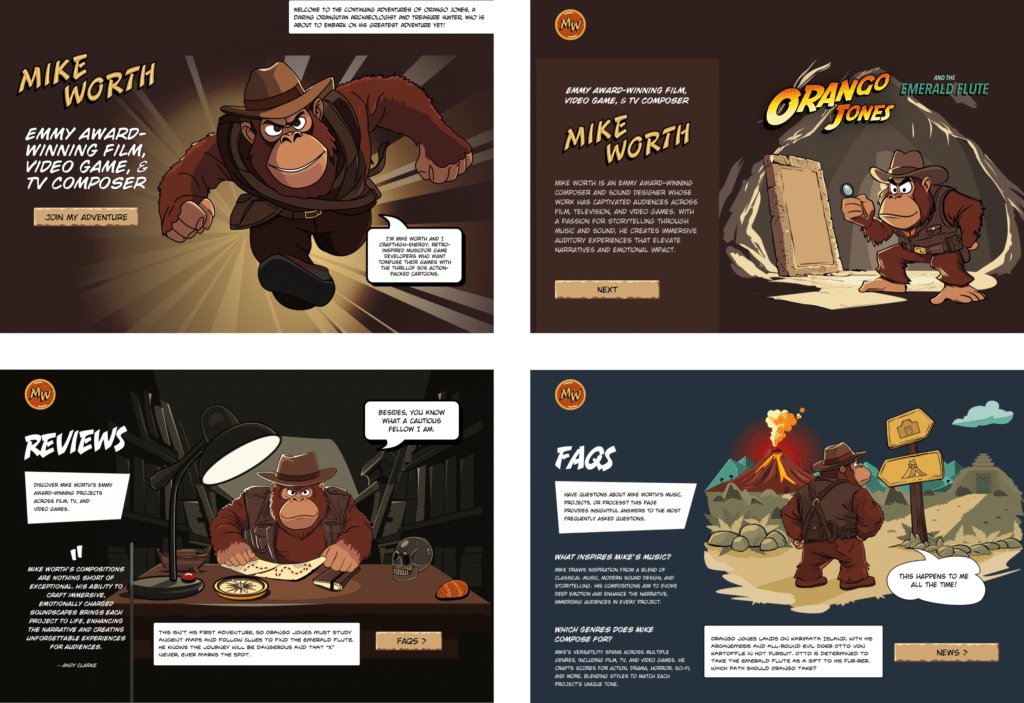
I mentioned last time that I’ve been working on a new website for Emmy-award-winning game composer Mike Worth. He hired me to create a highly graphical design that showcases his work.
Mike loves ’90s animation, particularly Disney’s Duck Tales and other animated series. He challenged me to find a way to incorporate their retro ’90s style into his design without making it a pastiche. But that wasn’t my only challenge. I also needed to achieve that ’90s feel by using up-to-the-minute code to maintain accessibility, performance, responsiveness, and semantics.

Designing for Mike was like a trip back to when mainstream website design seemed more spontaneous and less governed by conventions and best practices. Some people describe these designs as “whimsical”:
adjective
- spontaneously fanciful or playful
- given to whims; capricious
- quaint, unusual, or fantastic
— Collins English Dictionary
But I’m not so sure that’s entirely accurate. “Playful?” Definitely. “Fanciful?” Possibly. But “fantastic?” That depends. “Whimsy” sounds superfluous, so I call it “expressive” instead.
Studying design from way back, I remembered how websites often included graphics that combined branding, content, and navigation. Pretty much every reference to web design in the ’90s — when I designed my first website — talks about Warner Brothers’ Space Jam from 1996.

So, I’m not going to do that.
Brands like Nintendo used their home pages to direct people to their content while making branded visual statements. Cheestrings combined graphics with navigation, making me wonder why we don’t see designs like this today. Goosebumps typified this approach, combining cartoon illustrations with brightly colored shapes into a functional and visually rich banner, proving that being useful doesn’t mean being boring.

In the ’90s, when I developed graphics for websites like these, I either sliced them up and put their parts in tables or used mostly forgotten image maps.
A brief overview of properties and values
Let’s run through a quick refresher. Image maps date all the way back to HTML 3.2, where, first, server-side maps and then client-side maps defined clickable regions over an image using map and area elements. They were popular for graphics, maps, and navigation, but their use declined with the rise of CSS, SVG, and JavaScript.
<map> adds clickable areas to a bitmap or vector image.
<map name="projects">
  ...
</map>
That <map> is linked to an image using the usemap attribute:
<img usemap="#projects" ...>Those elements can have separate href and alt attributes and can be enhanced with ARIA to improve accessibility:
<map name="projects">
  <area href="" alt="" … />
  ...
</map>
The shape attribute specifies an area’s shape. It can be a primitive circle or rect or a polygon defined by a set of absolute x and y coordinates:
<area shape="circle" coords="..." ... />
<area shape="rect" coords="..." ... />
<area shape="poly" coords="..." ... />
Despite their age, image maps still offer plenty of benefits. They’re lightweight and need (almost) no JavaScript. More on that in just a minute. They’re accessible and semantic when used with alt, ARIA, and title attributes. Despite being from a different era, even modern mobile browsers support image maps.

My design for Mike Worth includes several graphic navigation elements, which made me wonder if image maps might still be an appropriate solution.
Image maps in action
Mike wants his website to showcase his past work and the projects he’d like to do. To make this aspect of his design discoverable and fun, I created a map for people to explore by pressing on areas of the map to open modals. This map contains numbered circles, and pressing one pops up its modal.

My first thought was to embed anchors into the external map SVG:
<img src="projects.svg" alt="Projects">

<svg ...>
  ...
  <a href="...">
    <circle cx="35" cy="35" r="35" fill="#941B2F"/>
    <path fill="#FFF" d="..."/>
  </a>
</svg>
This approach is problematic. Those anchors are only active when SVG is inline and don’t work with an <img> element. But image maps work perfectly, even though specifying their coordinates can be laborious. Fortunately, plenty of tools are available, which make defining coordinates less tedious. Upload an image, choose shape types, draw the shapes, and copy the markup:
<img src="projects.svg" usemap="#projects-map.svg">

<map name="projects-map.svg">
  <area href="" alt="" coords="..." shape="circle">
  <area href="" alt="" coords="..." shape="circle">
  ...
</map>
Image maps work well when images are fixed sizes, but flexible images present a problem because map coordinates are absolute, not relative to an image’s dimensions. Making image maps responsive needs a little JavaScript to recalculate those coordinates when the image changes size:
function resizeMap() {
  const image = document.getElementById("projects");
  const map = document.querySelector("map[name='projects-map']");

  if (!image || !map || !image.naturalWidth) return;

  const scale = image.clientWidth / image.naturalWidth;
  map.querySelectorAll("area").forEach(area => {

    if (!area.dataset.originalCoords) {
      area.dataset.originalCoords = area.getAttribute("coords");
    }

    const scaledCoords = area.dataset.originalCoords

    .split(",")
    .map(coord => Math.round(coord * scale))
    .join(",");
    area.setAttribute("coords", scaledCoords);
  });
}

["load", "resize"].forEach(event =>
  window.addEventListener(event, resizeMap)
);
I still wasn’t happy with this implementation as I wanted someone to be able to press on much larger map areas, not just the numbered circles.
Every <path> has coordinates which define how it’s drawn, and they’re relative to the SVG viewBox:
<svg width="1024" height="1024">
  <path fill="#BFBFBF" d="…"/>
</svg>
On the other hand, a map’s <area> coordinates are absolute to the top-left of an image, so <path> values need to be converted. Fortunately, Raphael Monnerat has written PathToPoints, a tool which does precisely that. Upload an SVG, choose the point frequency, copy the coordinates for each path, and add them to a map area’s coords:
<map>
  <area href="" shape="poly" coords="...">
  <area href="" shape="poly" coords="...">
  <area href="" shape="poly" coords="...">
  ...
</map>
More issues with image maps
Image maps are hard-coded and time-consuming to create without tools. Even with tools for generating image maps, converting paths to points, and then recalculating them using JavaScript, they could be challenging to maintain at scale.
<area> elements aren’t visible, and except for a change in the cursor, they provide no visual feedback when someone hovers over or presses a link. Plus, there’s no easy way to add animations or interaction effects.
But the deal-breaker for me was that an image map’s pixel-based values are unresponsive by default. So, what might be an alternative solution for implementing my map using CSS, HTML, and SVG?

Anchors positioned absolutely over my map wouldn’t solve the pixel-based positioning problem or give me the irregular-shaped clickable areas I wanted. Anchors within an external SVG wouldn’t work either.
But the solution was staring me in the face. I realized I needed to:
- Create a new SVG path for each clickable area.
- Make those paths invisible.
- Wrap each path inside an anchor.
- Place the anchors below other elements at the end of my SVG source.
- Replace that external file with inline SVG.

I created a set of six much larger paths which define the clickable areas, each with its own fill to match its numbered circle. I placed each anchor at the end of my SVG source:
<svg … viewBox="0 0 1024 1024">

  <!-- Visible content -->
  <g>...</g>

  <!-- Clickable areas -->`
  <g id="links">`
    <a href="..."><path fill="#B48F4C" d="..."/></a>`
    <a href="..."><path fill="#6FA676" d="..."/></a>`
    <a href="..."><path fill="#30201D" d="..."/></a>`
    ...
  </g>
</svg>
Then, I reduced those anchors’ opacity to 0 and added a short transition to their full-opacity hover state:
#links a {
  opacity: 0;
  transition: all .25s ease-in-out;
}

#links a:hover {
  opacity: 1;
}
While using an image map’s <area> sadly provides no visual feedback, embedded anchors and their content can respond to someone’s action, hint at what’s to come, and add detail and depth to a design.

I might add gloss to those numbered circles to be consistent with the branding I’ve designed for Mike. Or, I could include images, titles, or other content to preview the pop-up modals:
<g id="links">
  <a href="…">
    <path fill="#B48F4C" d="..."/>
    <image href="..." ... />
  </a>
</g>
Try it for yourself:
Expressive design, modern techniques
Designing Mike Worth’s website gave me a chance to blend expressive design with modern development techniques, and revisiting image maps reminded me just how important a tool image maps were during the period Mike loves so much.
Ultimately, image maps weren’t the right tool for Mike’s website. But exploring them helped me understand what I really needed: a way to recapture the expressiveness and personality of ’90s website design using modern techniques that are accessible, lightweight, responsive, and semantic. That’s what design’s about: choosing the right tool for a job, even if that sometimes means looking back to move forward.
Biography: Andy Clarke
Often referred to as one of the pioneers of web design, Andy Clarke has been instrumental in pushing the boundaries of web design and is known for his creative and visually stunning designs. His work has inspired countless designers to explore the full potential of product and website design.
Andy’s written several industry-leading books, including Transcending CSS, Hardboiled Web Design, and Art Direction for the Web. He’s also worked with businesses of all sizes and industries to achieve their goals through design.
Visit Andy’s studio, Stuff & Nonsense, and check out his Contract Killer, the popular web design contract template trusted by thousands of web designers and developers.
Revisiting Image Maps originally published on CSS-Tricks, which is part of the DigitalOcean family. You should get the newsletter.
Source: Read MoreÂ

