


Sometimes purely looking at an Azure DevOps backlog or Board may not tell the right story in terms of progress made towards a specific goal. At first glance, it may seem like a horror story, but in reality, it is not the case. The data needs to be read or conveyed in the right way.
Though Azure DevOps provides multiple ways to view work items, it also provides a powerful reporting capability in terms of writing queries and configuring dashboards.
Work Items in Azure DevOps contain various fields which can enable data reports. However, to make that data meaningful, the right queries and the use of dashboards can help to present the precise state of the work.
Author purposeful Queries
Every Azure DevOps query should have a motive. Fields on work items are attributes which can help to provide an answer. Let us look at a few use cases and how those queries are configured.
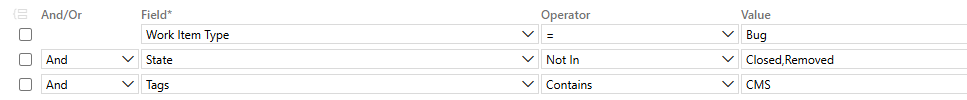
Example 1: I want to find all Bugs in my project that are not in a State of ‘Closed’ or ‘Removed’ and which contain a tag ‘CMS’. I can use the work item fields ‘Work Item Type,’ ‘State,’ and ‘Tags’ to find any matches.
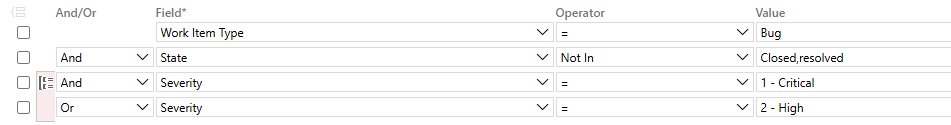
Example 2: I want to find all Bugs that are Severity 1 or Severity 2 that are not Closed or Resolved (I want to see only Severity 1 or 2 Bugs that are in New or Active State.) In this example, I have grouped the 2 rows for Severity to be an ‘Or’ condition. This allows me to get results that include both Severity 1 and Severity 2 results.
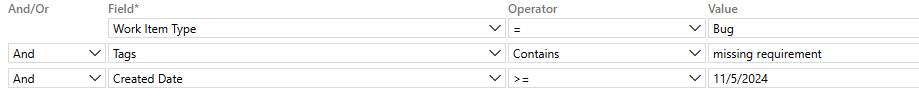
Example 3: I want to find all Bugs that contain the Tag “missing requirement” which were created on or after November 5, 2024. Another helpful attribute to report on is by Date – in this example, I am querying for results created after a specific date, but you can change the operator or set a date range for further control of results.
Tips:
-
- In these examples, I am using out-of-box field types, however, there are ways to create custom fields for an Azure DevOps project, to further enrich or customize your reports.
- Review the columns you have showing once you run a query. You may need to use the ‘Column Options’ to enable additional columns for additional data points.
- Save your query as a Shared Query, so that its results can be viewed by other members of the team.
Having these queries is great if you need a list of work items or if you want to make bulk updates for items which match your criteria. However, we can take these results a step further by visualizing the data onto a Dashboard.
Publish your results with Dashboards
Sometimes visuals can help to better portray a story; the same can be true when reporting on a project’s progress.
Out-of-the-box, Azure DevOps provides a variety of widget types which can be used to configure a Dashboard. Some widgets require the use of a Query, while others are purely based on settings you define.
Here are a few examples of widgets I use most often:
- Burndown: This widget does NOT require a query. When you place the widget, you’ll be able to control how data is pulled:
- Work Item Type
- Dates span
- Team (if applicable)
- Field Criteria
- Interval of time (days/weeks/months)
- Chart for Work Items: This widget is based on a Query. I find this widget to be very versatile, as you can choose the type of chart and which data points you want to display.
- Query Results: This widget is based on a Query and will simply display the results in a list, however, you can select which columns of data to show/hide in the widget.
- Query Tiles: This widget is based on a Query and will display the number of results matching a query. You can further customize this widget to dynamically show in unique colors, based on specific count criteria.
Tips:
-
- There is no limit to the number of Dashboards you can have. Consider creating Dashboards for unique purposes or for unique audiences, which contain only the relevant data needed.
- Queries and Dashboards are only as good as your data. Make sure you are regularly maintaining your work items to ensure they are tagged, parented, and prioritized appropriately.
- There is also an option to export query results into excel files, if you find that dashboard widgets are not filling all your reporting needs.
Convey the Story
Identify what is most important for your team or client to know, monitor, or be aware of. Once you have the data you need, you will be better equipped to explain progress and status to your team and the client.
In my personal experience, some types of unique dashboards I found to be effective for my clients or team members:
- Dashboard related to UAT activities
- Dashboard for Backlog Maintenance monitoring
- Dashboard for Executives
- Dashboard for QA Sprint-Based Activities
- Dashboard for Dependency monitoring
Example of an Executive Dashboard, using Burndown, Chart for Work Items, and Query Tile widgets: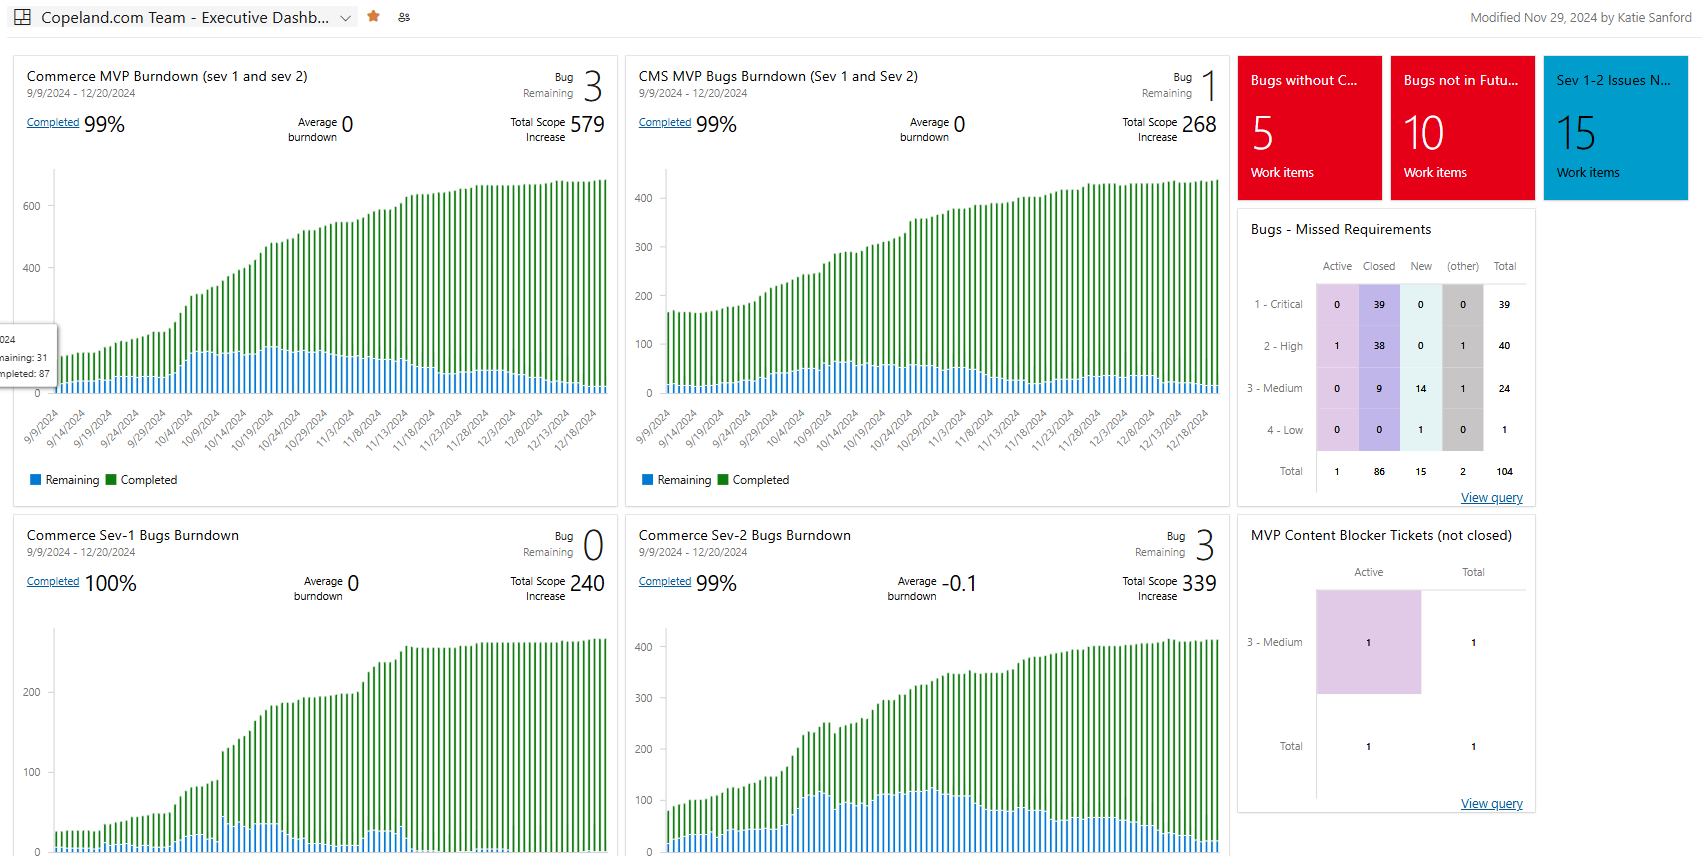
With each of these dashboards, I wrote unique queries to find data that my team or client most often needed to reference. This enabled them to know if we were on track or if some action is needed.
By having a precise way to explain the story of your project, you will find that your team is able to make better decisions when the right data is available to them, in order to lead to a happy project ending.
Source: Read MoreÂ

