Today, we are excited to announce that Mistral AI’s Pixtral Large foundation model (FM) is generally available in Amazon Bedrock. With this launch, you can now access Mistral’s frontier-class multimodal model to build, experiment, and responsibly scale your generative AI ideas on AWS. AWS is the first major cloud provider to deliver Pixtral Large as a fully managed, serverless model.
In this post, we discuss the features of Pixtral Large and its possible use cases.
Overview of Pixtral Large
Pixtral Large is an advanced multimodal model developed by Mistral AI, featuring 124 billion parameters. This model combines a powerful 123-billion-parameter multimodal decoder with a specialized 1-billion-parameter vision encoder. It can seamlessly handle complex visual and textual tasks while retaining the exceptional language-processing capabilities of its predecessor, Mistral Large 2.
A distinguishing feature of Pixtral Large is its expansive context window of 128,000 tokens, enabling it to simultaneously process multiple images alongside extensive textual data. This capability makes it particularly effective in analyzing documents, detailed charts, graphs, and natural images, accommodating a broad range of practical applications.
The following are key capabilities of Pixtral Large:
- Multilingual Text Analysis – Pixtral Large accurately interprets and extracts written information across multiple languages from images and documents. This is particularly beneficial for tasks like automatically processing receipts or invoices, where it can perform calculations and context-aware evaluations, streamlining processes such as expense tracking or financial analysis.
- Chart and data visualization interpretation – The model demonstrates exceptional proficiency in understanding complex visual data representations. It can effortlessly identify trends, anomalies, and key data points within graphical visualizations. For instance, Pixtral Large is highly effective at spotting irregularities or insightful trends within training loss curves or performance metrics, enhancing the accuracy of data-driven decision-making.
- General visual analysis and contextual understanding – Pixtral Large is adept at analyzing general visual data, including screenshots and photographs, extracting nuanced insights, and responding effectively to queries based on image content. This capability significantly broadens its usability, allowing it to support varied scenarios—from explaining visual contexts in presentations to automating content moderation and contextual image retrieval.
Additional model details include:
- Pixtral Large is available in the
eu-north-1andus-west-2AWS Regions - Cross-Region inference is available for the following Regions:
us-east-2us-west-2us-east-1eu-west-1eu-west-3eu-north-1eu-central-1
- Model ID:
mistral.pixtral-large-2502-v1:0 - Context window:
128,000
Get started with Pixtral Large in Amazon Bedrock
If you’re new to using Mistral AI models, you can request model access on the Amazon Bedrock console. For more information, see Access Amazon Bedrock foundation models.
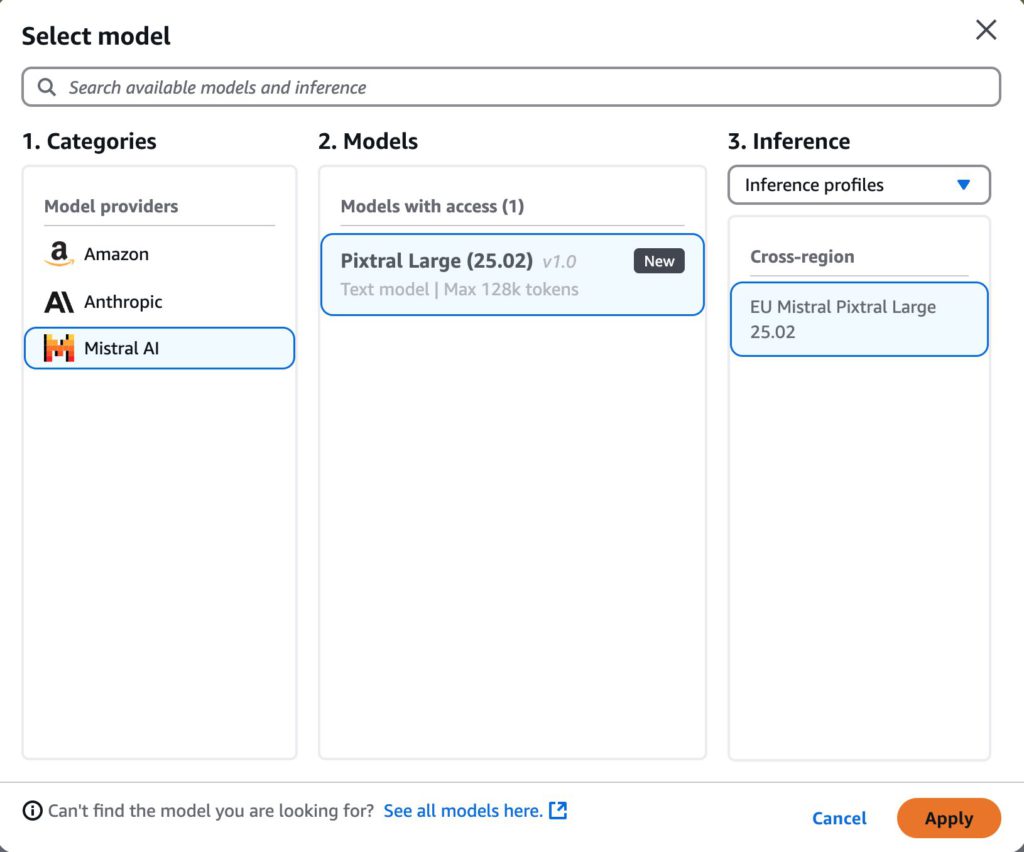
To test Pixtral Large on the Amazon Bedrock console, choose Text or Chat under Playgrounds in the navigation pane. Then, choose Select model and choose Mistral as the category and Pixtral Large as the model.

By choosing View API, you can also access the model using code examples in the AWS Command Line Interface (AWS CLI) and AWS SDKs. You can use a model ID such as mistral.mistral-large-2407-v1:0, as shown in the following code:
In the following sections, we dive into the capabilities of Pixtral Large.
Pixtral Large use cases
In this section, we provide example use cases of Pixtral Large using sample prompts. Because Pixtral Large is built on Mistral Large 2, it includes a native JSON output mode. This feature enables developers to receive the model’s responses in a structured and simple-to-read format, which can be seamlessly integrated into various applications and systems. Because JSON is a widely used data exchange standard, this functionality streamlines the process of working with the model’s outputs, making it more accessible and practical for developers across different industries and use cases. For more information on generating JSON using the Converse API, refer to Generating JSON with the Amazon Bedrock Converse API.
Additionally, Pixtral Large supports the Converse API and tool usage. By using the Amazon Bedrock API, you can grant the model access to tools that assist in generating responses to the messages you send.
Generate SQL code from a database entity-relationship diagram
An entity-relationship (ER) diagram is a visual representation used in database design to illustrate the relationships between entities and their attributes. It is a crucial tool for conceptual modeling, helping developers and analysts understand and communicate the structure of data within a database.
This example tests the model’s ability to generate PostgreSQL-compatible SQL CREATE TABLE statements for creating entities and their relationships.
We use the following prompt:
We input the following ER diagram.

The model response is as follows:
Convert organization hierarchy to structured text
Pixtral Large has the capabilities to understand organization structure and generate structured output. Let’s test it with an organization structure.
We use the following prompt:
We input the following organization structure image.

The model response is as follows:
Chart understanding and reasoning
Pixtral Large has the capability to understand and reason over charts and graphs. Let’s test Pixtral Large with a visualization of the portion of motorcycle ownership per country around the world.
We use the following prompt:
We input the following image.

By Dennis Bratland – Own work, CC BY-SA 3.0, https://commons.wikimedia.org/w/index.php?curid=15186498
The model response is as follows:
Conclusion
In this post, we demonstrated how to get started with the Pixtral Large model in Amazon Bedrock. The Pixtral Large multimodal model allows you to tackle a variety of use cases, such as document understanding, logical reasoning, handwriting recognition, image comparison, entity extraction, extracting structured data from scanned images, and caption generation. These capabilities can enhance productivity across numerous enterprise applications, including ecommerce (retail), marketing, financial services, and beyond.
Mistral AI’s Pixtral Large FM is now available in Amazon Bedrock. To get started with Pixtral Large in Amazon Bedrock, visit the Amazon Bedrock console.
Curious to explore further? Take a look at the Mistral-on-AWS repo. For more information on Mistral AI models available on Amazon Bedrock, refer to Mistral AI models now available on Amazon Bedrock.
About the Authors
 Deepesh Dhapola is a Senior Solutions Architect at AWS India, specializing in helping financial services and fintech clients optimize and scale their applications on the AWS Cloud. With a strong focus on trending AI technologies, including generative AI, AI agents, and the Model Context Protocol (MCP), Deepesh leverages his expertise in machine learning to design innovative, scalable, and secure solutions. Passionate about the transformative potential of AI, he actively explores cutting-edge advancements to drive efficiency and innovation for AWS customers. Outside of work, Deepesh enjoys spending quality time with his family and experimenting with diverse culinary creations.
 Andre Boaventura is a Principal AI/ML Solutions Architect at AWS, specializing in generative AI and scalable machine learning solutions. With over 25 years in the high-tech software industry, he has deep expertise in designing and deploying AI applications using AWS services such as Amazon Bedrock, Amazon SageMaker, and Amazon Q. Andre works closely with global system integrators (GSIs) and customers across industries to architect and implement cutting-edge AI/ML solutions to drive business value.
 Preston Tuggle is a Sr. Specialist Solutions Architect with the Third-Party Model Provider team at AWS. He focuses on working with model providers across Amazon Bedrock and Amazon SageMaker, helping them accelerate their go-to-market strategies through technical scaling initiatives and customer engagement
 Shane Rai is a Principal GenAI Specialist with the AWS World Wide Specialist Organization (WWSO). He works with customers across industries to solve their most pressing and innovative business needs using AWS’s breadth of cloud-based AI/ML services, including model offerings from top-tier foundation model providers.
 Ankit Agarwal is a Senior Technical Product Manager at Amazon Bedrock, where he operates at the intersection of customer needs and foundation model providers. He leads initiatives to onboard cutting-edge models onto Amazon Bedrock Serverless and drives the development of core features that enhance the platform’s capabilities.
 Niithiyn Vijeaswaran is a Generative AI Specialist Solutions Architect with the Third-Party Model Science team at AWS. His area of focus is AWS AI accelerators (AWS Neuron). He holds a Bachelor’s in Computer Science and Bioinformatics.
 Aris Tsakpinis is a Specialist Solutions Architect for Generative AI focusing on open source models on Amazon Bedrock and the broader generative AI open source ecosystem. Alongside his professional role, he is pursuing a PhD in Machine Learning Engineering at the University of Regensburg, where his research focuses on applied natural language processing in scientific domains.
Source: Read MoreÂ


