
Employee productivity is a critical factor in maintaining a competitive advantage. Amazon Q Business offers a unique opportunity to enhance workforce efficiency by providing AI-powered assistance that can significantly reduce the time spent searching for information, generating content, and completing routine tasks. Amazon Q Business is a fully managed, generative AI-powered assistant that lets you build interactive chat applications using your enterprise data, generating answers based on your data or large language model (LLM) knowledge. At the core of this capability are native data source connectors that seamlessly integrate and index content from multiple data sources like Salesforce, Jira, and SharePoint into a unified index.
Key benefits for organizations include:
- Simplified deployment and management – Provides a ready-to-use web experience with no machine learning (ML) infrastructure to maintain or manage
- Access controls – Makes sure users only access content they have permission to view
- Accurate query responses – Delivers precise answers with source citations, analyzing enterprise data
- Privacy and control – Offers comprehensive guardrails and fine-grained access controls
- Broad connectivity – Supports over 45 native data source connectors (at the time of writing), and provides the ability to create custom connectors
Data privacy and the protection of intellectual property are paramount concerns for most organizations. At Amazon, “Security is Job Zero,” which is why Amazon Q Business is designed with these critical considerations in mind. Your data is not used for training purposes, and the answers provided by Amazon Q Business are based solely on the data users have access to. This makes sure that enterprises can quickly find answers to questions, provide summaries, generate content, and complete tasks across various use cases with complete confidence in data security. Amazon Q Business supports encryption in transit and at rest, allowing end-users to use their own encryption keys for added security. This robust security framework enables end-users to receive immediate, permissions-aware responses from enterprise data sources with citations, helping streamline workplace tasks while maintaining the highest standards of data privacy and protection.
Amazon Q Business Insights provides administrators with details about the utilization and effectiveness of their AI-powered applications. By monitoring utilization metrics, organizations can quantify the actual productivity gains achieved with Amazon Q Business. Understanding how employees interact with and use Amazon Q Business becomes crucial for measuring its return on investment and identifying potential areas for further optimization. Tracking metrics such as time saved and number of queries resolved can provide tangible evidence of the service’s impact on overall workplace productivity. It’s essential for admins to periodically review these metrics to understand how users are engaging with Amazon Q Business and identify potential areas of improvement.
The dashboard enables administrators to track user interactions, including the helpfulness of generated answers through user ratings. By visualizing this feedback, admins can pinpoint instances where users aren’t receiving satisfactory responses. With Amazon Q Business Insights, administrators can diagnose potential issues such as unclear user prompts, misconfigured topics and guardrails, insufficient metadata boosters, or inadequate data source configurations. This comprehensive analytics approach empowers organizations to continuously refine their Amazon Q Business implementation, making sure users receive the most relevant and helpful AI-assisted support.
In this post, we explore Amazon Q Business Insights capabilities and its importance for organizations. We begin with an overview of the available metrics and how they can be used for measuring user engagement and system effectiveness. Then we provide instructions for accessing and navigating this dashboard. Finally, we demonstrate how to integrate Amazon Q Business logs with Amazon CloudWatch, enabling deeper insights into user interaction patterns and identifying areas for improvement. This integration can empower administrators to make data-driven decisions for optimizing their Amazon Q Business implementations and maximizing return on investment (ROI).
Amazon Q Business and Amazon Q Apps analytics dashboards
In this section, we discuss the Amazon Q Business and Amazon Q Apps analytics dashboards.
Overview of key metrics
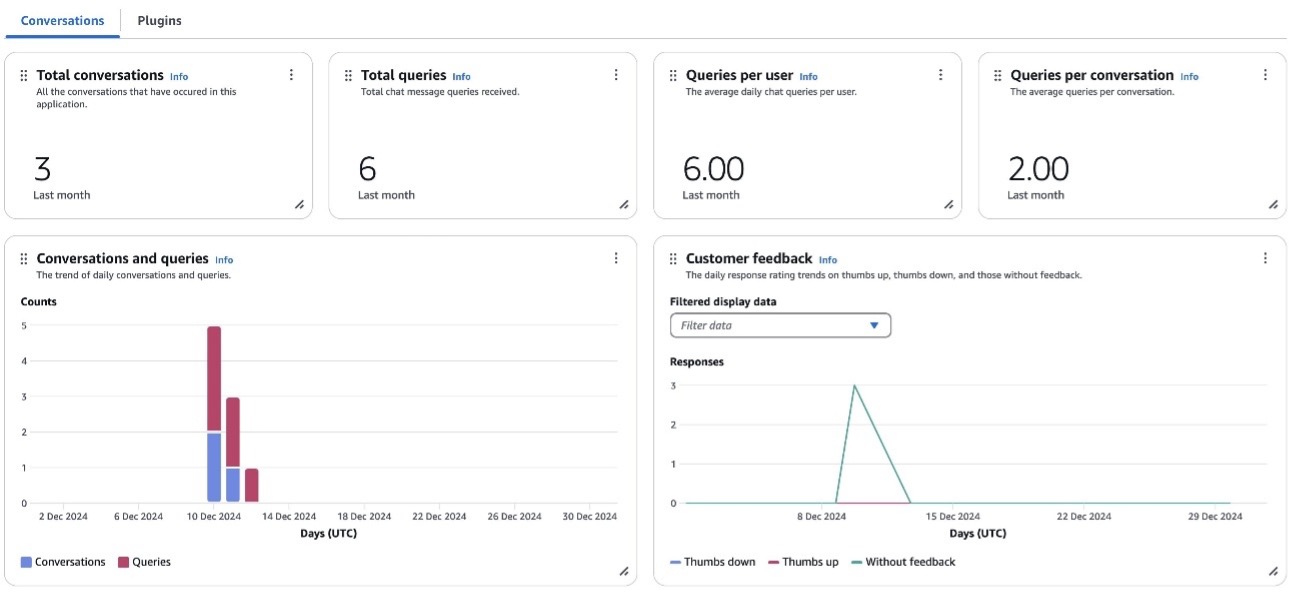
Amazon Q Business Insights (see the following screenshot) offers a comprehensive set of metrics that provide valuable insights into user engagement and system performance. Key metrics include Total queries and Total conversations, which give an overall picture of system usage. More specific metrics such as Queries per conversation and Queries per user offer deeper insights into user interaction patterns and the complexity of inquiries. The Number of conversations and Number of queries metrics help administrators track adoption and usage trends over time.
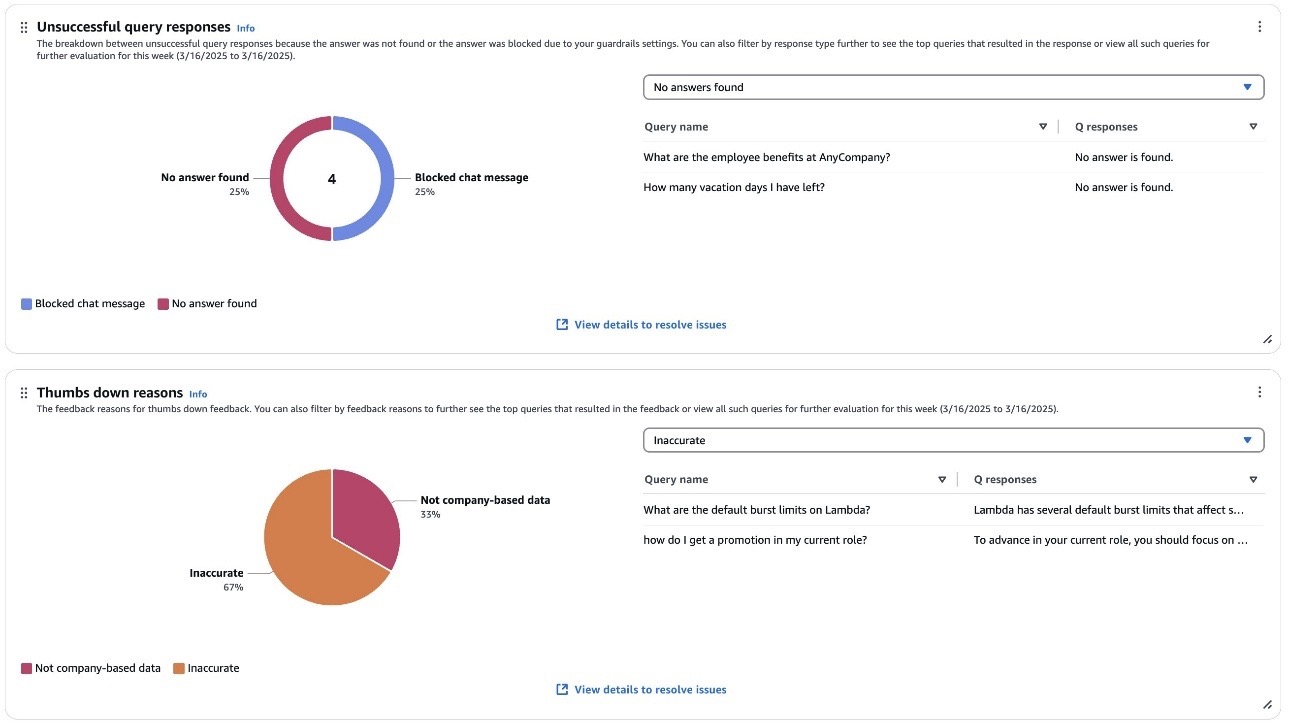
The dashboard also provides critical information on system effectiveness through metrics like Unsuccessful query responses and Thumbs down reasons (see the following screenshot), which highlight areas where the AI assistant might be struggling to provide adequate answers. This is complemented by the end-user feedback metric, which includes user ratings and response effectiveness reasons. These metrics are particularly valuable for identifying specific issues users are encountering and areas where the system needs improvement.
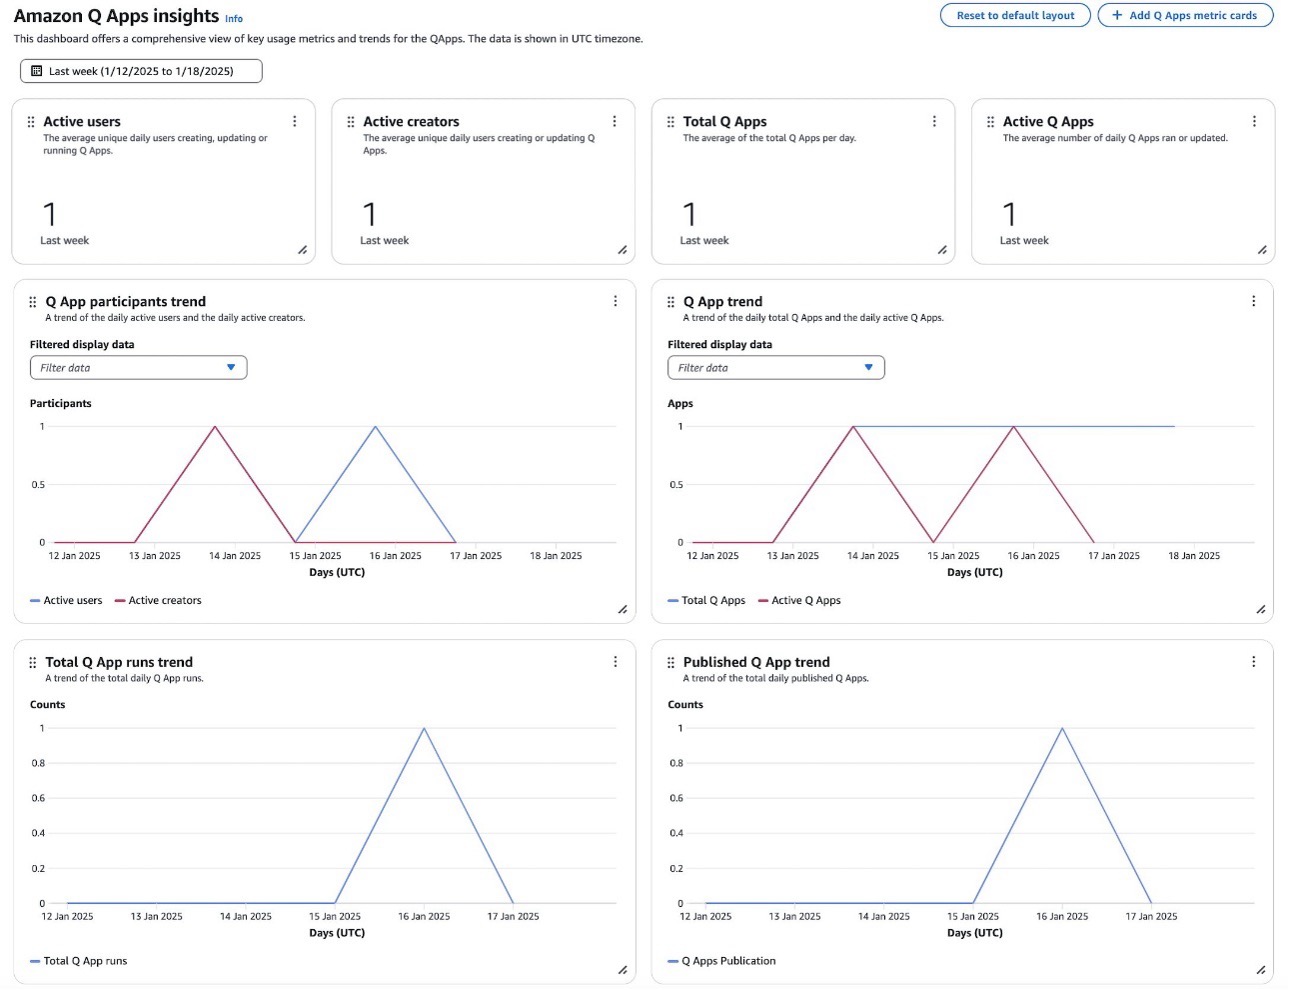
Complementing the main dashboard, Amazon Q Business provides a dedicated analytics dashboard for Amazon Q Apps that offers detailed insights into application creation, usage, and adoption patterns. The dashboard tracks user engagement through metrics like:
- Active users (average unique daily users interacting with Amazon Q Apps)
- Active creators (average unique daily users creating or updating Amazon Q Apps)
Application metrics include:
- Total Q Apps (average daily total)
- Active Q Apps (average number of applications run or updated daily)
These metrics help provide a clear picture of application utilization.
The dashboard also features several trend analyses that help administrators understand usage patterns over time:
- Q App participants trend shows the relationship between daily active users and creators
- Q App trend displays the correlation between total applications created and active applications
- Total Q App runs trend and Published Q App trend track daily execution rates and publication patterns, respectively
These metrics enable administrators to evaluate the performance and adoption of Amazon Q Apps within their organization, helping identify successful implementation patterns and areas needing attention.
These comprehensive metrics are crucial for organizations to optimize their Amazon Q Business implementation and maximize ROI. By analyzing trends in Total queries, Total conversations, and user-specific metrics, administrators can gauge adoption rates and identify potential areas for user training or system improvements. The Unsuccessful query responses and Customer feedback metrics help pinpoint gaps in the knowledge base or areas where the system struggles to provide satisfactory answers. By using these metrics, organizations can make data-driven decisions to enhance the effectiveness of their AI-powered assistant, ultimately leading to improved productivity and user experience across various use cases within the enterprise.
How to access Amazon Q Business Insights dashboards
As an Amazon Q admin, you can view the dashboards on the Amazon Q Business console. You can view the metrics in these dashboards over different pre-selected time intervals. They are available at no additional charge in AWS Regions where the Amazon Q Business service is offered.
To view these dashboards on the Amazon Q Business console, you choose your application environment and navigate to the Insights page. For more details, see Viewing the analytics dashboards.
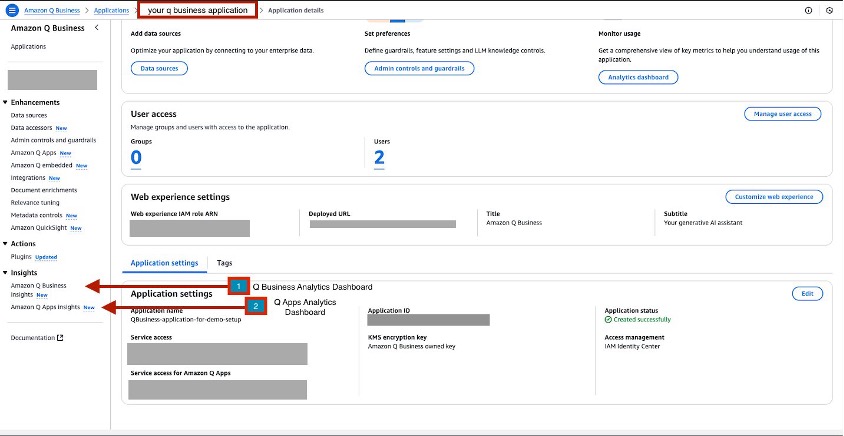
The following screenshot illustrates how to access the dashboards for Amazon Q Business applications and Amazon Q Apps Insights.
Monitor Amazon Q Business user conversations
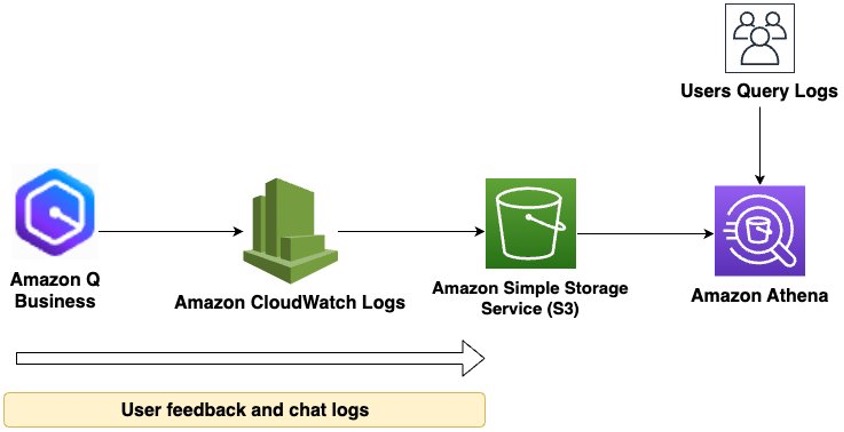
In addition to Amazon Q Business and Amazon Q Apps dashboards, you can use Amazon CloudWatch Logs to deliver user conversations and response feedback in Amazon Q Business for you to analyze. These logs can be delivered to multiple destinations, such as CloudWatch, Amazon Simple Storage Service (Amazon S3), or Amazon Data Firehose.
The following diagram depicts the flow of user conversation and feedback responses from Amazon Q Business to Amazon S3. These logs are then queryable using Amazon Athena.
Prerequisites
To set up CloudWatch Logs for Amazon Q Business, make sure you have the appropriate permissions for the intended destination. Refer to Monitoring Amazon Q Business and Q Apps for more details.
Set up log delivery with CloudWatch as a destination
Complete the following steps to set up log delivery with CloudWatch as the destination:
- Open the Amazon Q Business console and sign in to your account.
- In Applications, choose the name of your application environment.
- In the navigation pane, choose Enhancements and choose Admin Controls and Guardrails.
- In Log delivery, choose Add and select the option To Amazon CloudWatch Logs.
- For Destination log group, enter the log group where the logs will be stored.
Log groups prefixed with /aws/vendedlogs/ will be created automatically. Other log groups must be created prior to setting up a log delivery.
- To filter out sensitive or personally identifiable information (PII), choose Additional settings – optional and specify the fields to be logged, output format, and field delimiter.
If you want the users’ email recorded in your logs, it must be added explicitly as a field in Additional settings.
- Choose Add.
- Choose Enable logging to start streaming conversation and feedback data to your logging destination.
Set up log delivery with Amazon S3 as a destination
To use Amazon S3 as a log destination, you will need an S3 bucket and grant Amazon Q Business the appropriate permissions to write your logs to Amazon S3.
- Open the Amazon Q Business console and sign in to your account.
- In Applications, choose the name of your application environment.
- In the navigation pane, choose Enhancements and choose Admin Controls and Guardrails.
- In Log delivery, choose Add and select the option To Amazon S3
- For Destination S3 bucket, enter your bucket.
- To filter out sensitive or PII data, choose Additional settings – optional and specify the fields to be logged, output format, and field delimiter.
If you want the users’ email recorded in your logs, it must be added explicitly as a field in Additional settings.
- Choose Add.
- Choose Enable logging to start streaming conversation and feedback data to your logging destination.
The logs are delivered to your S3 bucket with the following prefix: AWSLogs/<your-aws-account-id>/AmazonQBusinessLogs/<your-aws-region>/<your-q-business-application--id>/year/month/day/hour/ The placeholders will be replaced with your AWS account, Region, and Amazon Q Business application identifier, respectively.
Set up Data Firehose as a log destination
Amazon Q Business application event logs can also be streamed to Data Firehose as a destination. This can be used for real-time observability. We have excluded setup instructions for brevity.
To use Data Firehose as a log destination, you need to create a Firehose delivery stream (with Direct PUT enabled) and grant Amazon Q Business the appropriate permissions to write your logs to Data Firehose. For example AWS Identity and Access Management (IAM) policies with the required permissions for your specific logging destination, see Enable logging from AWS services.
Protecting sensitive data
You can prevent an AWS console user or group of users from viewing specific CloudWatch log groups, S3 buckets, or Firehose streams by applying specific deny statements in their IAM policies. AWS follows an explicit deny overrides allow model, meaning that if you explicitly deny an action, it will take precedence over allow statements. For more information, see Policy evaluation logic.
Real-world use cases
This section outlines several key use cases for Amazon Q Business Insights, demonstrating how you can use Amazon Q Business operational data to improve your operational posture to help Amazon Q Business meet your needs.
Measure ROI using Amazon Q Business Insights
The dashboards offered by Amazon Q Business Insights provide powerful metrics that help organizations quantify their ROI. Consider this common scenario: traditionally, employees spend countless hours searching through siloed documents, knowledge bases, and various repositories to find answers to their questions. This time-consuming process not only impacts productivity but also leads to significant operational costs. With the dashboards provided by Amazon Q Business Insights, administrators can now measure the actual impact of their investment by tracking key metrics such as total questions answered, total conversations, active users, and positive feedback rates. For instance, if an organization knows that it previously took employees an average of 3 minutes to find an answer in their documentation, and with Amazon Q Business this time is reduced to 20 seconds, they can calculate the time savings per query (2 minutes and 40 seconds). When the dashboard shows 1,000 successful queries per week, this translates to approximately 44 hours of productivity gained—time that employees can now dedicate to higher-value tasks. Organizations can then translate these productivity gains into tangible cost savings based on their specific business metrics.
Furthermore, the dashboard’s positive feedback rate metric helps validate the quality and accuracy of responses, making sure employees aren’t just getting answers, but reliable ones that help them do their jobs effectively. By analyzing these metrics over time—whether it’s over 24 hours, 7 days, or 30 days—organizations can demonstrate how Amazon Q Business is transforming their knowledge management approach from a fragmented, time-intensive process to an efficient, centralized system. This data-driven approach to measuring ROI not only justifies the investment but also helps identify areas where the service can be optimized for even greater returns.
Organizations looking to quantify financial benefits can develop their own ROI calculators tailored to their specific needs. By combining Amazon Q Business Insights metrics with their internal business variables, teams can create customized ROI models that reflect their unique operational context. Several reference calculators are publicly available online, ranging from basic templates to more sophisticated models, which can serve as a starting point for organizations to build their own ROI analysis tools. This approach enables leadership teams to demonstrate the tangible financial benefits of their Amazon Q Business investment and make data-driven decisions about scaling their implementation, based on their organization’s specific metrics and success criteria.
Enforce financial services compliance with Amazon Q Business analytics
Maintaining regulatory compliance while enabling productivity is a delicate balance. As organizations adopt AI-powered tools like Amazon Q Business, it’s crucial to implement proper controls and monitoring. Let’s explore how a financial services organization can use Amazon Q Business Insights capabilities and logging features to maintain compliance and protect against policy violations.
Consider this scenario: A large investment firm has adopted Amazon Q Business to help their financial advisors quickly access client information, investment policies, and regulatory documentation. However, the compliance team needs to make sure the system isn’t being used to circumvent trading restrictions, particularly around day trading activities that could violate SEC regulations and company policies.
Identify policy violations through Amazon Q Business logs
When the compliance team enables log delivery to CloudWatch with the user_email field selected, Amazon Q Business begins sending detailed event logs to CloudWatch. These logs are separated into two CloudWatch log streams:
- QBusiness/Chat/Message – Contains user interactions
- QBusiness/Chat/Feedback – Contains user feedback on responses
For example, the compliance team monitoring the logs might spot this concerning chat from Amazon Q Business:
The compliance team can automate this search by creating an alarm on CloudWatch Metrics Insights queries in CloudWatch.
Implement preventative controls
Upon identifying these attempts, the Amazon Q Business admin can implement several immediate controls within Amazon Q Business:
- Configure blocked phrases to make sure chat responses don’t include these words
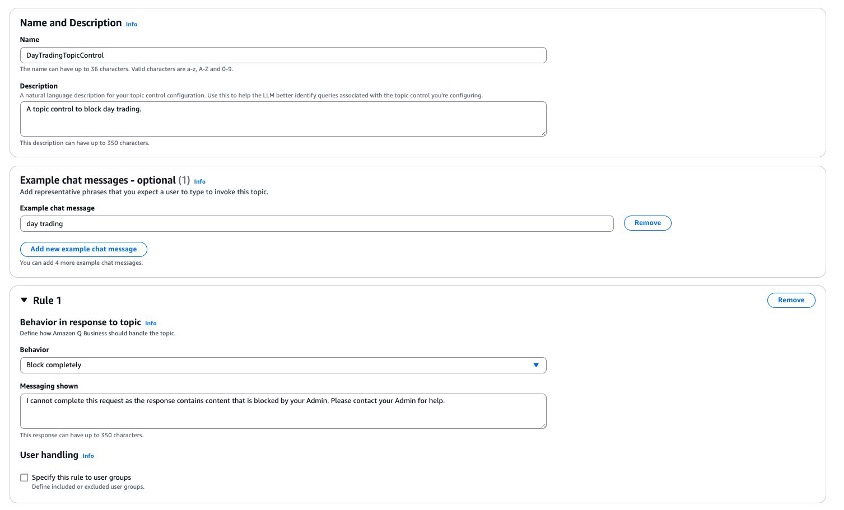
- Configure topic-level controls to configure rules to customize how Amazon Q Business should respond when a chat message matches a special topic
The following screenshot depicts configuring topic-level controls for the phrase “day trading.”
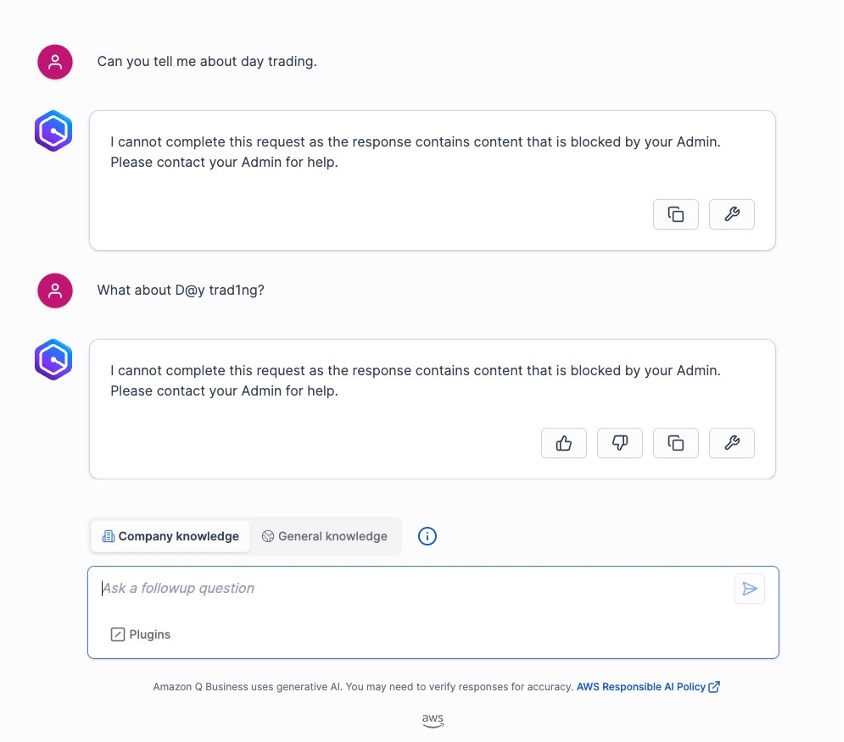
Using the previous topic-level controls, different variations of the phrase “day trading” will be blocked. The following screenshot represents a user entering variations of the phrase “day trading” and how Amazon Q Business blocks that phrase due to the topic-level control for the phrase.
By implementing monitoring and configuring guardrails, the investment firm can maintain its regulatory compliance while still allowing legitimate use of Amazon Q Business for approved activities. The combination of real-time monitoring through logs and preventive guardrails creates a robust defense against potential violations while maintaining detailed audit trails for regulatory requirements.
Analyze user feedback through the Amazon Q Business Insights dashboard
After log delivery has been set up, administrators can use the Amazon Q Business Insights dashboard to get a comprehensive view of user feedback. This dashboard provides valuable data about user experience and areas needing improvement through two key metric cards: Unsuccessful query responses and Thumbs down reasons. The Thumbs down reasons chart offers a detailed breakdown of user feedback, displaying the distribution and frequency of specific reasons why users found responses unhelpful. This granular feedback helps administrators identify patterns in user feedback, whether it’s due to incomplete information, inaccurate responses, or other factors.
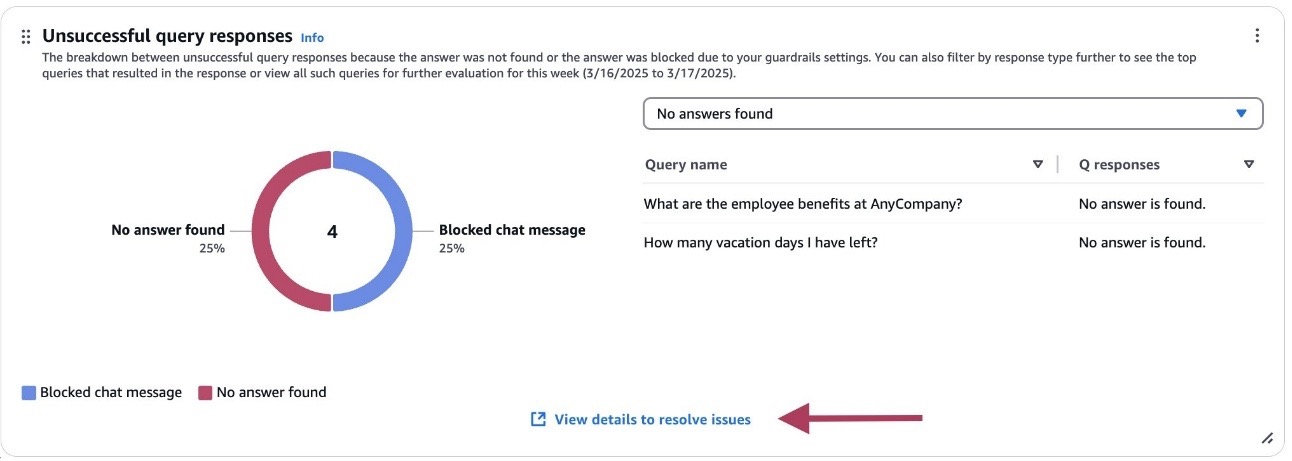
Similarly, the Unsuccessful query responses chart distinguishes between queries that failed because answers weren’t found in the knowledge base vs. those blocked by guardrail settings. Both metrics allow administrators to drill down into specific queries through filtering options and detailed views, enabling them to investigate and address issues systematically. This feedback loop is crucial for continuous improvement, helping organizations refine their content, adjust guardrails, and enhance the overall effectiveness of their Amazon Q Business implementation.
To view a breakdown of unsuccessful query responses, follow these steps:
- Select your application on the Amazon Q Business console.
- Select Amazon Q Business insights under Insights.
- Go to the Unsuccessful query responses metrics card and choose View details to resolve issues.
A new page will open with two tabs: No answers found and Blocked queries.
- You can use these tabs to filter by response type. You can also filter by date using the date filter at the top.
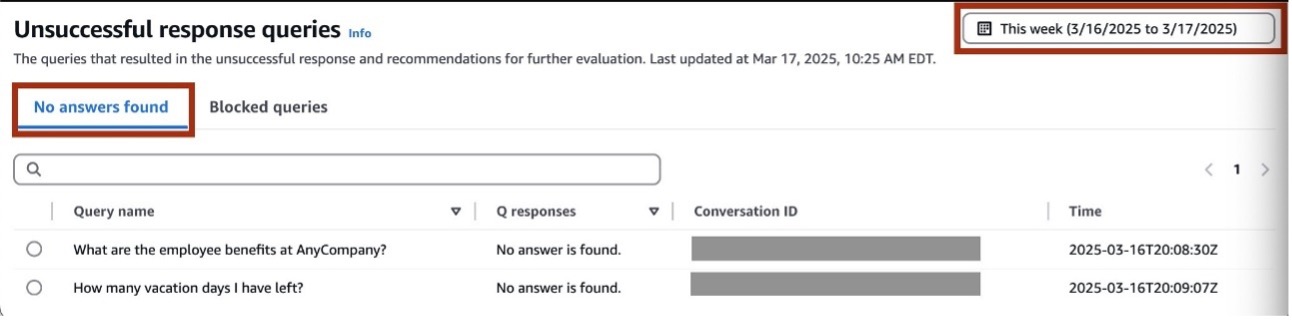
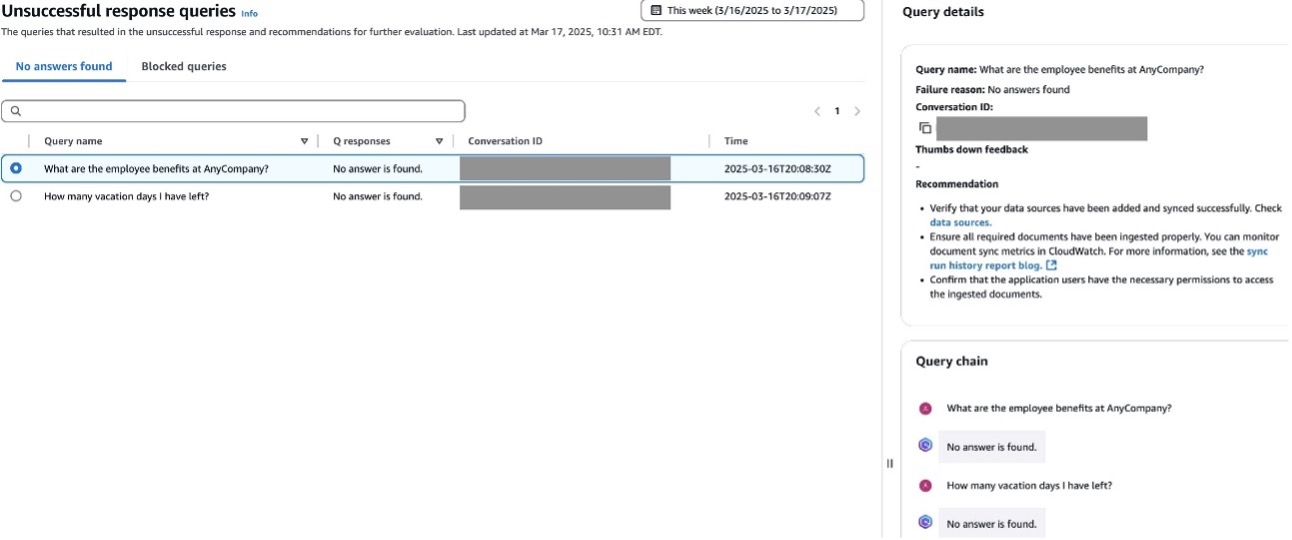
- Choose any of the queries to view the Query chain
This will give you more details and context on the conversation the user had when providing their feedback.
Analyze user feedback through CloudWatch logs
This use case focuses on identifying and analyzing unsatisfactory feedback from specific users in Amazon Q Business. After log delivery is enabled with the user_email field selected, the Amazon Q Business application sends event logs to the previously created CloudWatch log group. User chat interactions and feedback submissions generate events in the QBusiness/Chat/Message and QBusiness/Chat/Feedback log streams, respectively.
For example, consider if a user asks about their vacation policy and no answer is returned. The user can then choose the thumbs down icon and send feedback to the administrator.
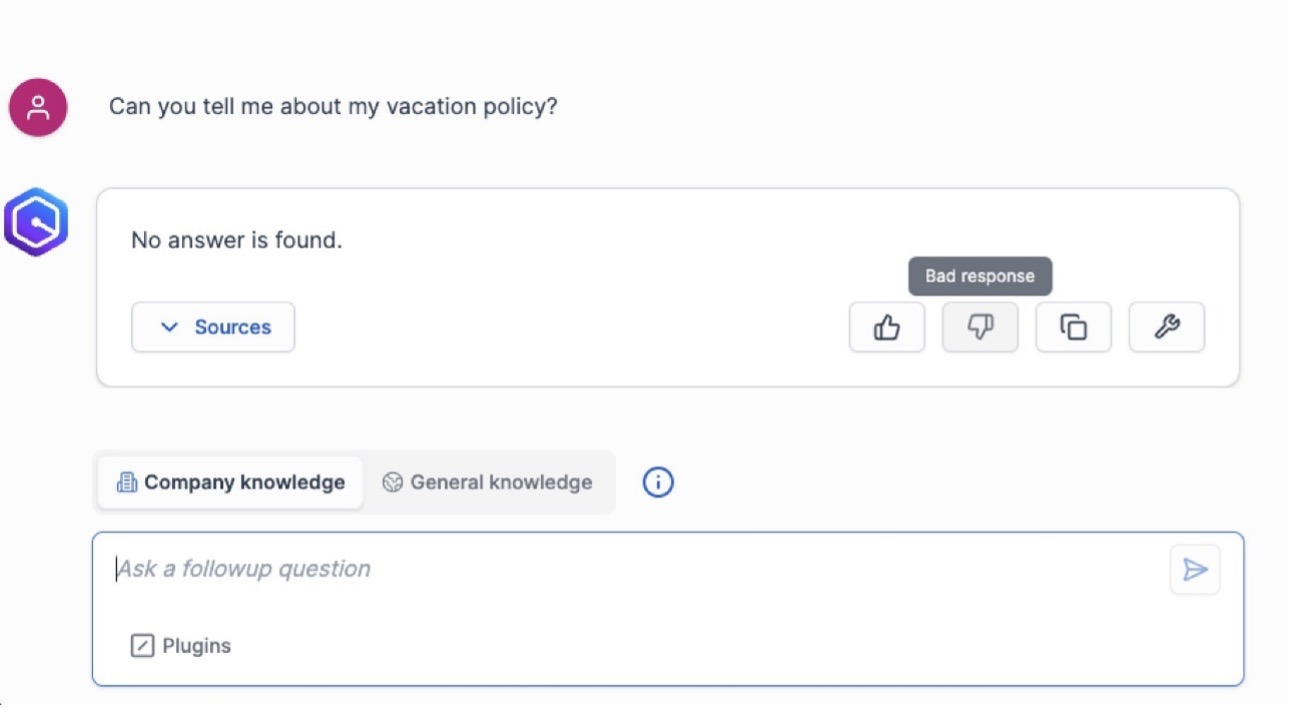
The Send your feedback form provides the user the option to categorize the feedback and provide additional details for the administrator to review.
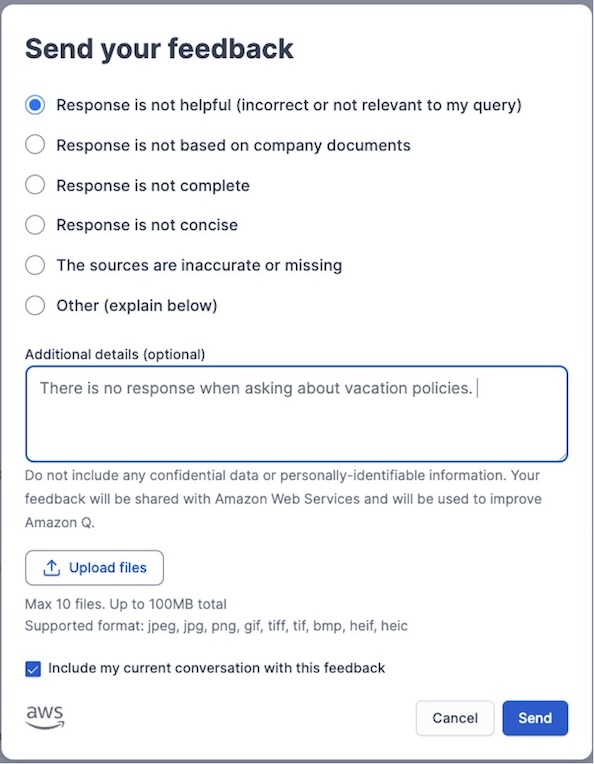
This feedback will be sent to the QBusiness/Chat/Feedback log stream for the administrator to later analyze. See the following example log entry:
By analyzing queries that result in unsatisfactory responses (thumbs down), administrators can take actions to improve answer quality, accuracy, and security. This feedback can help identify gaps in data sources. Patterns in feedback can indicate topics where users might benefit from extra training or guidance on effectively using Amazon Q Business.
To address issues identified through feedback analysis, administrators can take several actions:
- Configure metadata boosting to prioritize more accurate content in responses for queries that consistently receive negative feedback
- Refine guardrails and chat controls to better align with user expectations and organizational policies
- Develop targeted training or documentation to help users formulate more effective prompts, including prompt engineering techniques
- Analyze user prompts to identify potential risks and reinforce proper data handling practices
By monitoring the chat messages and which users are giving “thumbs up” or “thumbs down” responses for the associated prompts, administrators can gain insights into areas where the system might be underperforming, not meeting user expectations, or not complying with your organization’s security policies.
This use case is applicable to the other log delivery options, such as Amazon S3 and Data Firehose.
Group users getting the most unhelpful answers
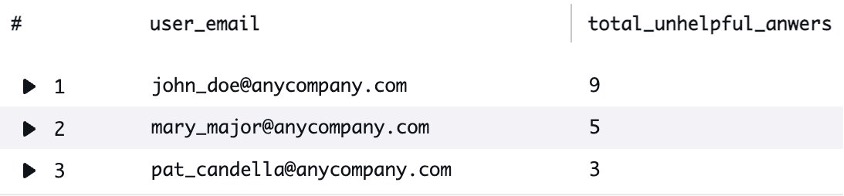
For administrators seeking more granular insights beyond the standard dashboard, CloudWatch Logs Insights offers a powerful tool for deep-dive analysis of Amazon Q Business usage metrics. By using CloudWatch Log Insights, administrators can create custom queries to extract and analyze detailed performance data. For instance, you can generate a sorted list of users experiencing the most unhelpful interactions, such as identifying which employees are consistently receiving unsatisfactory responses. A typical query might reveal patterns like “User A received 9 unhelpful answers in the last 4 weeks, User B received 5 unhelpful answers, and User C received 3 unhelpful answers.” This level of detailed analysis enables organizations to pinpoint specific user groups or departments that might require additional training, data source configuration, or targeted support to improve their Amazon Q Business experience.
To get these kinds of insights, complete the following steps:
- To obtain the Amazon Q Business application ID, open the Amazon Q Business console, open the specific application, and note the application ID on the Application settings
This unique identifier will be used to filter log groups in CloudWatch Logs Insights.
- On the CloudWatch console, choose Logs Insights under Logs in the navigation pane.

- Under Selection criteria, enter the application ID you previously copied. Choose the log group that follows the pattern
/aws/vendedlogs/qbusiness/application/EVENT_LOGS/<your application id>.
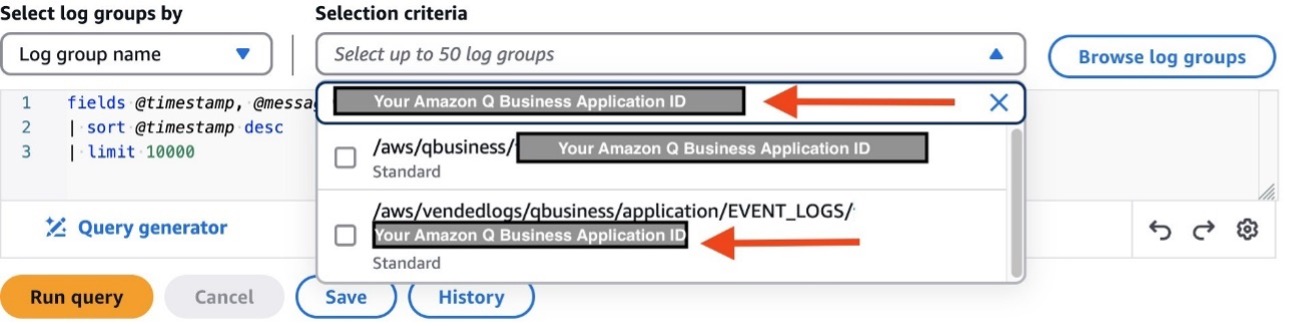
- For the data time range, select the range you want to use. In our case, we are using the last 4 weeks and so we choose Custom, then we specify 4 Weeks.
- Replace the default query in the editor with this one:
We use the condition NOT_USEFUL because we want to list users getting unhelpful answers. To get a list of users who received helpful answers, change the condition to USEFUL.
- Choose Run query.
With this information, particularly user_email, you can write a new query to analyze the conversation logs where users got unhelpful answers. For example, to list messages where user john_doe gave a thumbs down, replace your query with the following:
filter usefulness = "NOT_USEFUL" and user_email = "john_doe@anycompany.com"
Alternatively, to filter unhelpful answers, you could use the following query:
filter usefulness = "NOT_USEFUL"
The results of these queries can help you better understand the context of the feedback users are providing. As mentioned earlier, it might be possible your guardrails are too restrictive, your application is missing a data source, or maybe your users’ prompts are not clear enough.
Clean up
To make sure you don’t incur ongoing costs, clean up resources by removing log delivery configurations, deleting CloudWatch resources, removing the Amazon Q Business application, and deleting any additional AWS resources created after you’re done experimenting with this functionality.
Conclusion
In this post, we explored several ways to improve your operational posture with Amazon Q Business Insights dashboards, the Amazon Q Apps analytics dashboard, and logging with CloudWatch Logs. By using these tools, organizations can gain valuable insights into user engagement patterns, identify areas for improvement, and make sure their Amazon Q Business implementation aligns with security and compliance requirements.
To learn more about Amazon Q Business key usage metrics, refer to Viewing Amazon Q Business and Q App metrics in analytics dashboards. For a comprehensive review of Amazon Q Business CloudWatch logs, including log query examples, refer to Monitoring Amazon Q Business user conversations with Amazon CloudWatch Logs.
About the Authors
 Guillermo Mansilla is a Senior Solutions Architect based in Orlando, Florida. Guillermo has developed a keen interest in serverless architectures and generative AI applications. Prior to his current role, he gained over a decade of experience working as a software developer. Away from work, Guillermo enjoys participating in chess tournaments at his local chess club, a pursuit that allows him to exercise his analytical skills in a different context.
 Amit Gupta is a Senior Q Business Solutions Architect Solutions Architect at AWS. He is passionate about enabling customers with well-architected generative AI solutions at scale.
 Jed Lechner is a Specialist Solutions Architect at Amazon Web Services specializing in generative AI solutions with Amazon Q Business and Amazon Q Apps. Prior to his current role, he worked as a Software Engineer at AWS and other companies, focusing on sustainability technology, big data analytics, and cloud computing. Outside of work, he enjoys hiking and photography, and capturing nature’s moments through his lens.
 Leo Mentis Raj Selvaraj is a Sr. Specialist Solutions Architect – GenAI at AWS with 4.5 years of experience, currently guiding customers through their GenAI implementation journeys. Previously, he architected data platform and analytics solutions for strategic customers using a comprehensive range of AWS services including storage, compute, databases, serverless, analytics, and ML technologies. Leo also collaborates with internal AWS teams to drive product feature development based on customer feedback, contributing to the evolution of AWS offerings.
Source: Read MoreÂ

