


Most modern visualization authoring tools like Charticulator, Data Illustrator, and Lyra, and libraries like ggplot2, and VegaLite expect tidy data, where every variable to be visualized is a column and each observation is a row. When the input data is in a tidy format, authors simply need to bind data columns to visual channels, otherwise, they need to prepare the data, even if the original data is clean and contains all the information. Moreover, users must transform their data using specialized libraries like tidyverse or pandas, or separate tools like Wrangler before they can create visualizations. This requirement poses two major challenges – the need for programming expertise or specialized tool knowledge, and the inefficient workflow of constantly switching between data transformation and visualization steps.
Various approaches have emerged to simplify visualization creation, starting with the grammar of graphics concepts that established the foundation for mapping data to visual elements. High-level grammar-based tools like ggplot2, Vega-Lite, and Altair have gained popularity for their concise syntax and abstraction of complex implementation details. More advanced approaches include visualization by demonstration tools like Lyra 2 and VbD, which allow users to specify visualizations through direct manipulation. Natural language interfaces, such as NCNet and VisQA, have also been developed to make visualization creation more intuitive. However, these solutions either require tidy data input or introduce new complexities by focusing on low-level specifications similar to Falx.
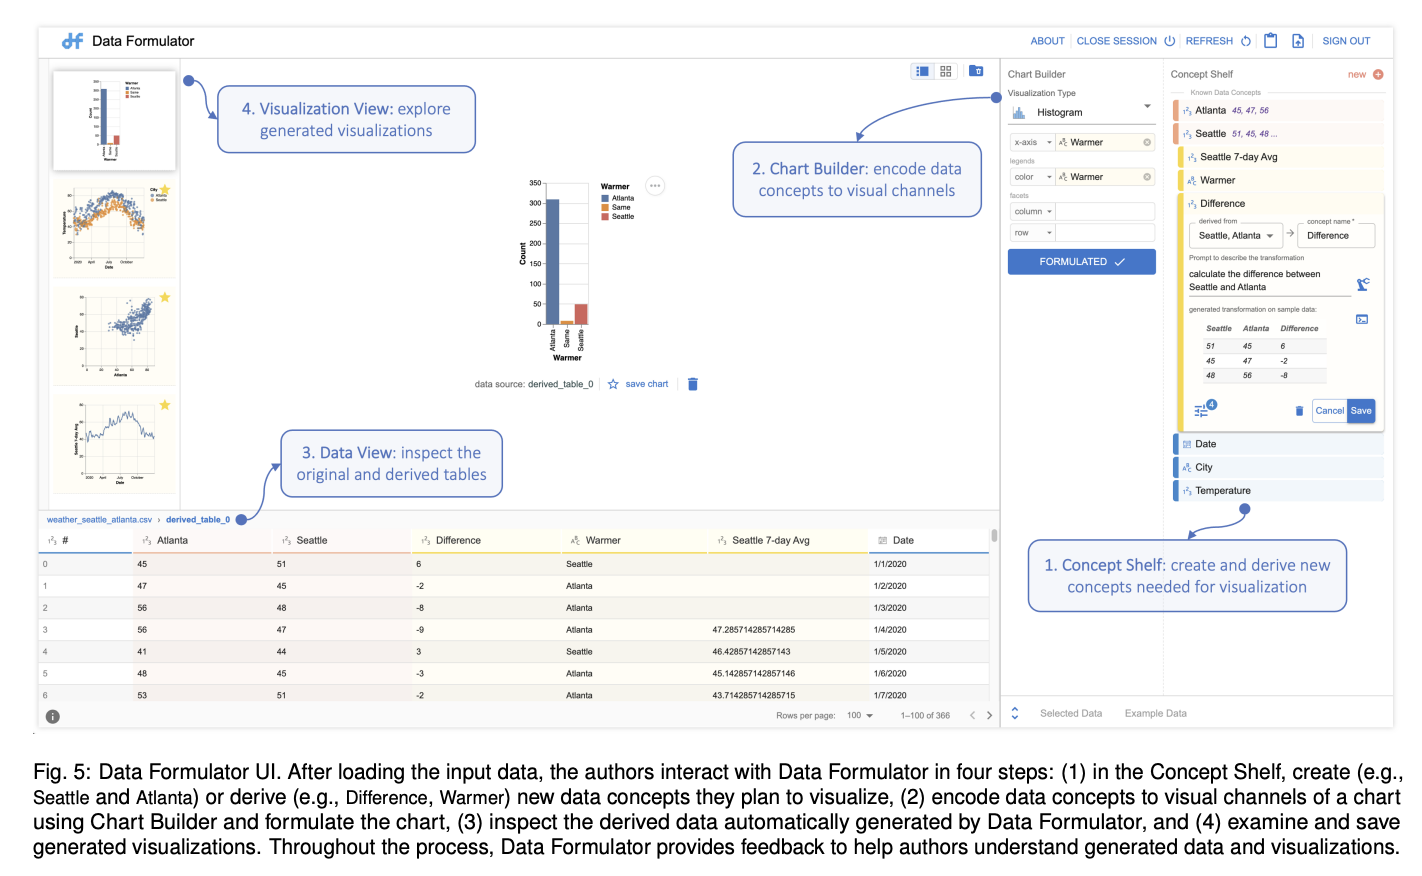
A team from Microsoft Research has proposed Data Formulator, an innovative visualization authoring tool built around a new paradigm called concept binding. It allows users to express their visualization intent by binding data concepts to visual channels, where data concepts can either come from existing columns or be created on demand. The tool supports two methods for creating new concepts: natural language prompts for data derivation and example-based input for data reshaping. When users select a chart type and map their desired concepts, Data Formulator’s AI backend infers the necessary data transformations and generates candidate visualizations. The system provides explanatory feedback for multiple candidates, enabling users to inspect, refine, and iterate on their visualizations through an intuitive interface.
Data Formulator’s architecture is built around the core concept of treating data concepts as first-class objects that serve as abstractions of existing and potential future table columns. This design fundamentally differs from traditional approaches by focusing on concept-level transformations rather than table-level operators, making it more intuitive for users to communicate with the AI agent and verify results. The natural language component of the tool utilizes LLMs’ ability to understand high-level intent and natural concepts, while the programming-by-example component offers precise, unambiguous reshaping operations through demonstration. This hybrid architecture allows users to work with familiar shelf-configuration tools while accessing powerful transformation capabilities.
Data Formulator’s evaluation through user testing revealed promising results in task completion and usability. Participants completed all assigned visualization tasks within an average time of 20 minutes, with Task 6 requiring the most time due to its complexity involving 7-day moving average calculations. The system’s dual-interaction approach proved effective, though some participants needed occasional hints regarding concept type selection and data type management. For derived concepts, users averaged 1.62 prompt attempts with relatively concise descriptions (average of 7.28 words), and the system generated approximately 1.94 candidates per prompt. Most challenges encountered were minor and related to interface familiarization rather than fundamental usability issues.
In conclusion, the team introduced Data Formulator which represents a significant advancement in visualization authoring by effectively addressing the persistent challenge of data transformation through its concept-driven approach. The tool’s innovative combination of AI assistance and user interaction enables authors to create complex visualizations without directly handling data transformations. User studies have validated the tool’s effectiveness, showing that even users facing complex data transformation requirements can successfully create their desired visualizations. Looking forward, this concept-driven visualization approach shows promise for influencing the next generation of visual data exploration and authoring tools, potentially eliminating the long-standing barrier of data transformation in visualization creation.
Check out the Paper and GitHub Page. All credit for this research goes to the researchers of this project. Also, feel free to follow us on Twitter and don’t forget to join our 75k+ ML SubReddit.
 Recommended Open-Source AI Platform: ‘IntellAgent is a An Open-Source Multi-Agent Framework to Evaluate Complex Conversational AI System’ (Promoted)
The post Microsoft Research Introduces Data Formulator: An AI Application that Leverages LLMs to Transform Data and Create Rich Visualizations appeared first on MarkTechPost.
Source: Read MoreÂ

