Reporting is a crucial aspect that helps QA engineers and developers analyze test execution, identify failures, and maintain software quality. If you are using Playwright Reports as your Automation Testing tool, your test automation reports will play a significant role in providing detailed insights into test performance, making debugging more efficient and test management seamless. Playwright has gained popularity among tech professionals due to its robust reporting capabilities and powerful debugging tools. It offers built-in reporters such as List, Line, Dot, HTML, JSON, and JUnit, allowing users to generate reports based on their specific needs. Additionally, Playwright supports third-party integrations like Allure, enabling more interactive and visually appealing test reports. With features like Playwright Trace Viewer, testers can analyze step-by-step execution details, making troubleshooting faster and more effective.
So in this blog, we will be exploring how you can leverage Playwright’s Reporting options to ensure a streamlined testing workflow, enhance debugging efficiency, and maintain high-quality software releases. Let’s start with the built-in reporting options in Playwright, and then move to the third party integrations.
Built-In Reporting Options in Playwright
There are numerous built-in Playwright reporting options to help teams analyze test results efficiently. These reporters vary in their level of detail, from minimal console outputs to detailed HTML and JSON reports. Below is a breakdown of each built-in reporting format along with sample outputs.
1. List Reporter
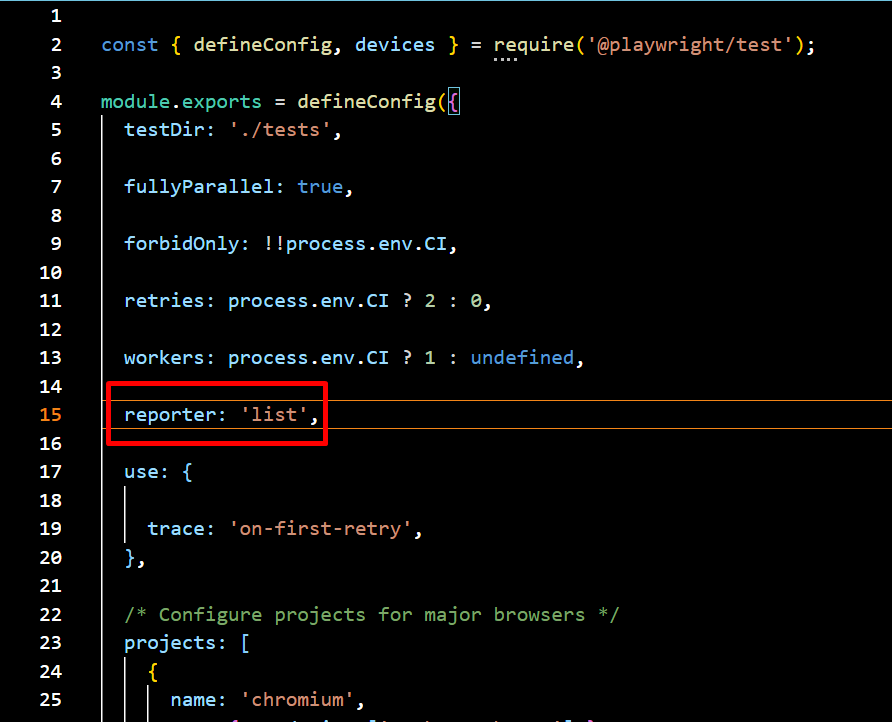
The List Reporter prints a line of output for each test, providing a clear and structured summary of test execution. It offers a readable format that helps quickly identify which tests have passed or failed. This makes it particularly useful for local debugging and development environments, allowing developers to analyze test results and troubleshoot issues efficiently
npx playwright test --reporter=list
Navigate to the config.spec.js file and update the reporter setting to switch it to the list format for better readability and detailed test run output.

Sample Output:
✓ test1.spec.js: Test A (Passed)

✗ test1.spec.js: Test B (Failed)

  → Expected value to be 'X', but received 'Y'

✓ test2.spec.js: Test C (Passed)
2. Line Reporter
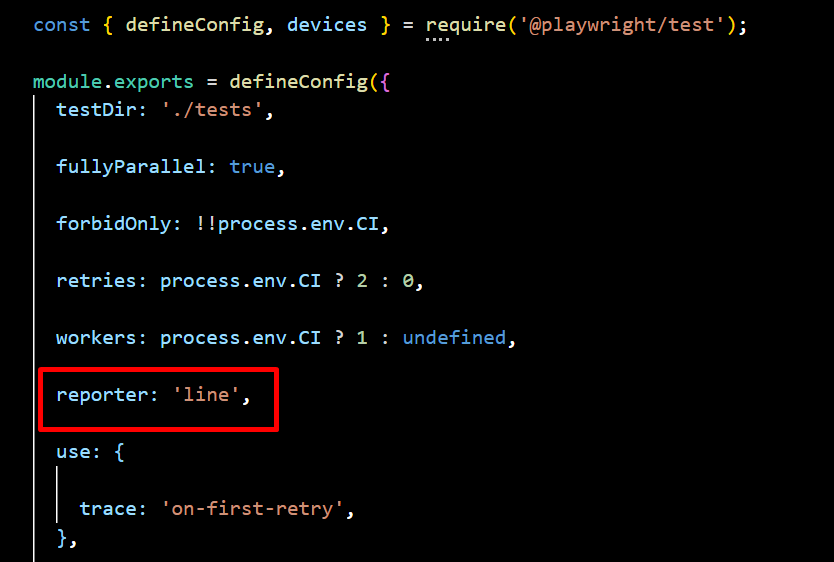
The Line Reporter is a compact version of the List Reporter, displaying test execution results in a single line. Its minimal and concise output makes it ideal for large test suites, providing real-time updates without cluttering the terminal. This format is best suited for quick debugging and monitoring test execution progress efficiently.
npx playwright test --reporter=line
Navigate to the config.spec.js file and update the reporter setting to switch it to the line format for better readability and detailed test run output.
Sample Output:
✔ 2 | ✖ 1 | ⏳ Running…
3. Dot Reporter
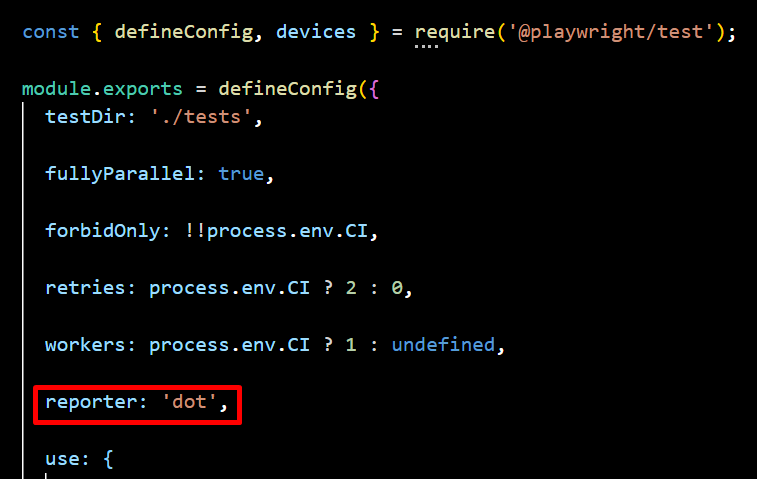
The Dot Reporter provides a minimalistic output, using a single character for each test—dots (.) for passing tests and “F” for failures. Its compact and simple format reduces log verbosity, making it ideal for CI/CD environments. This approach helps track execution progress efficiently without cluttering terminal logs, ensuring a clean and streamlined testing experience.
npx playwright test --reporter=dot
Navigate to the config.spec.js file and update the reporter setting to switch it to the dot format for better readability and detailed test run output.
Sample Output:
....F.....
4. HTML Reporter
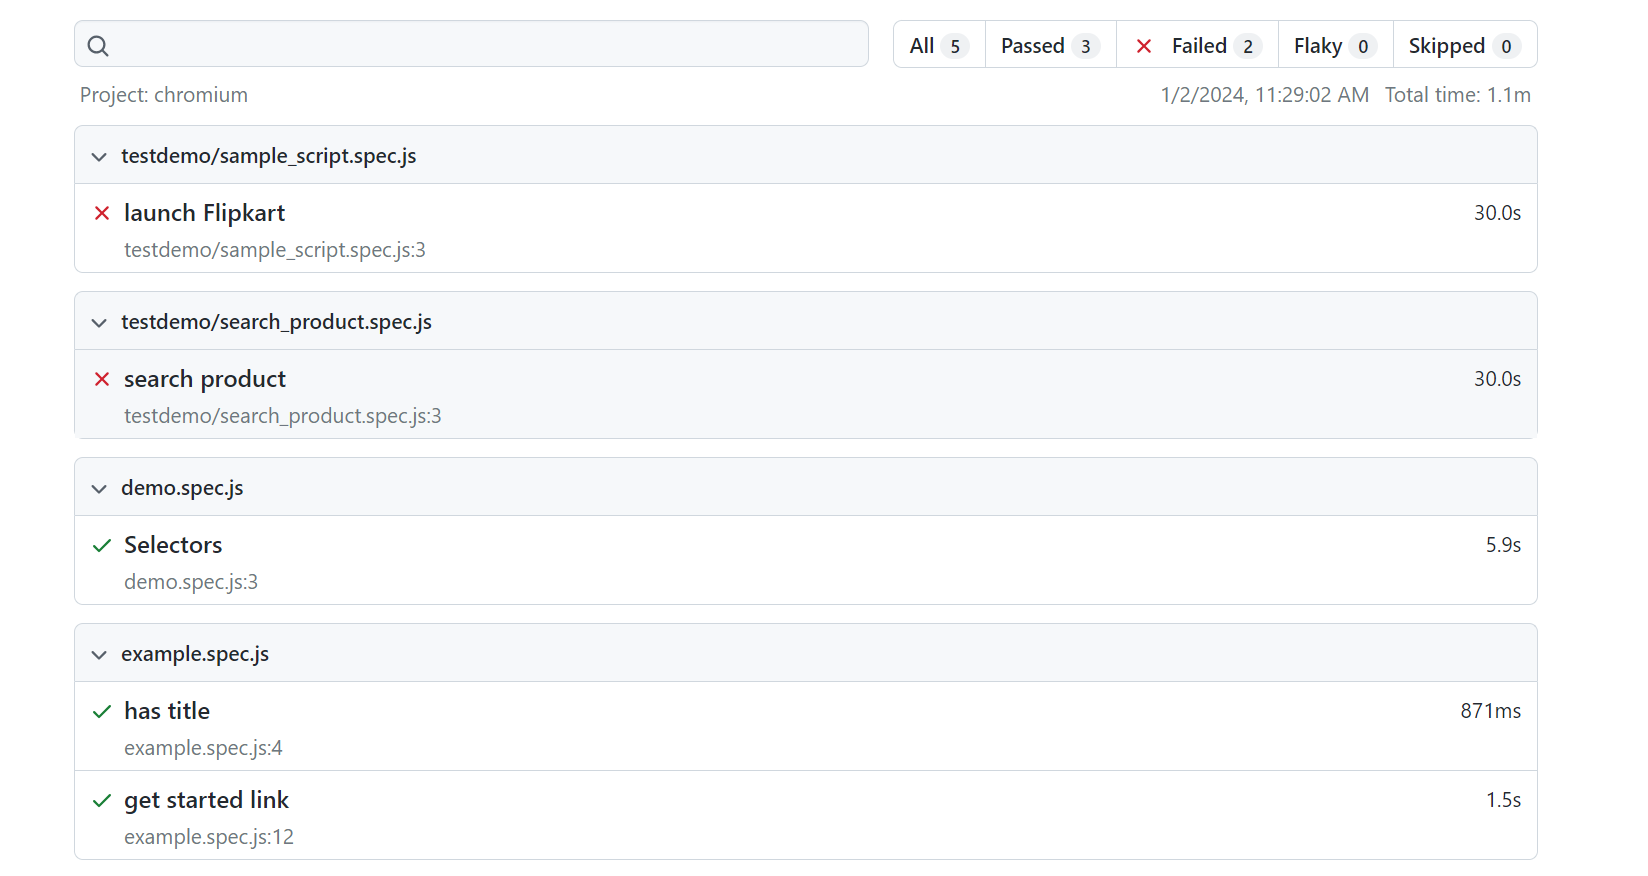
The HTML Reporter generates an interactive, web-based report that can be opened in a browser, providing a visually rich and easy-to-read summary of test execution. It includes detailed logs, screenshots, and test results, making analysis more intuitive. With built-in filtering and navigation features, it allows users to efficiently explore test outcomes. Additionally, its shareable format facilitates collaborative debugging across teams.
npx playwright test --reporter=html
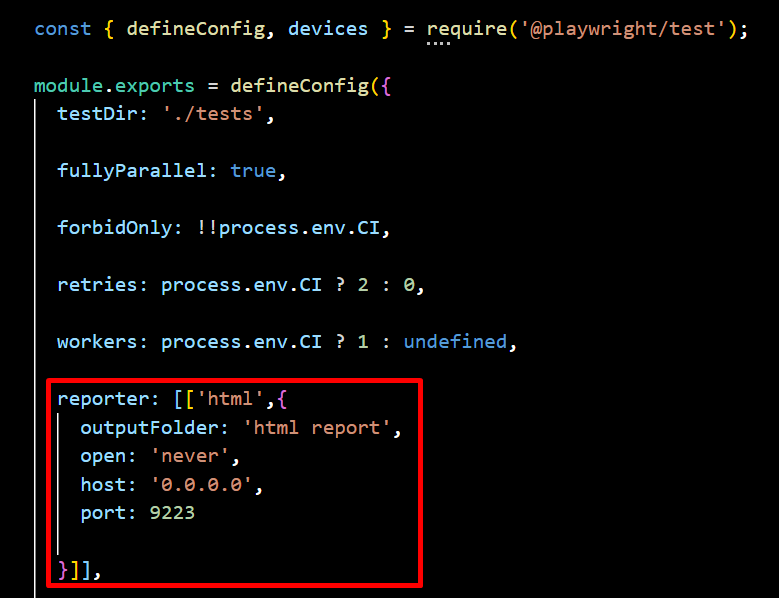
By default, when test execution is complete, the HTML Reporter opens the index.html file in the default browser. The open property in the Playwright configuration allows you to modify this behavior, with options such as always, never, and on-failures (default). If set to never, the report will not open automatically.
To specify where the report should open, use the host attribute to define the target IP address—setting it to 0.0.0.0 opens the report on localhost. Additionally, the port property lets you specify the port number, with 9223 being the default.
You can also customize the HTML report’s output location in the Playwright configuration file by specifying the desired folder. For example, if you want to store the report in the html-report directory, you can set the output path accordingly.
Sample Output:
5. JSON Reporter
The JSON Reporter outputs test results in a machine-readable JSON format, making it ideal for data analysis, automation, and integration with dashboards or external analytics tools. It enables seamless test monitoring, log storage, and auditing, providing a structured way to track and analyze test execution.
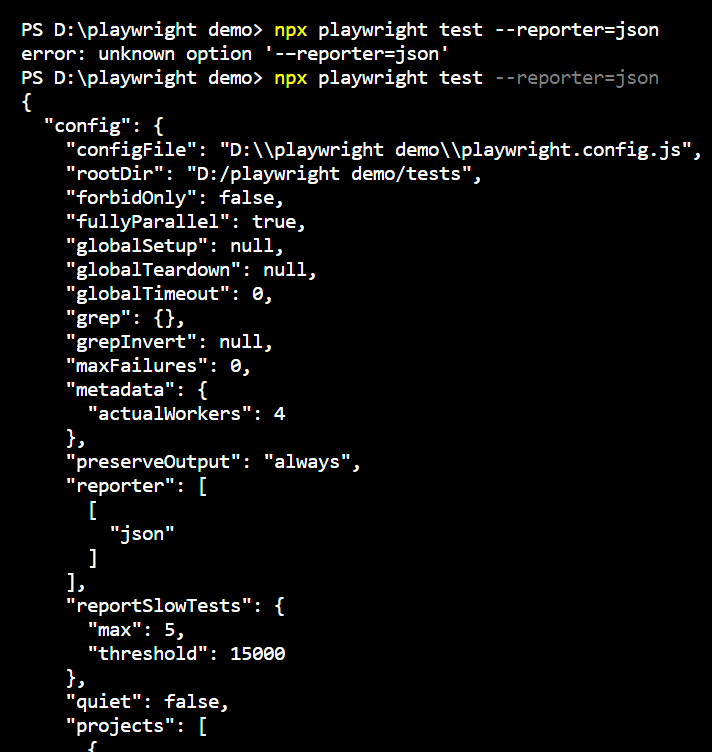
npx playwright test --reporter=json
Navigate to the config.spec.js file and specify the output file, then you can write the JSON to a file.
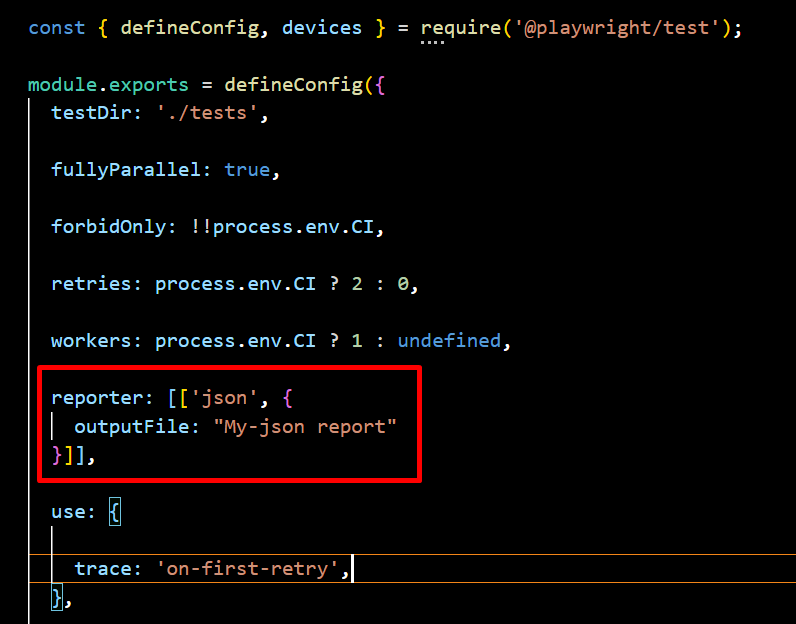
Sample JSON Report Output:
{

  "status": "completed",

  "tests": [

    {

      "name": "Test A",

      "status": "passed",

      "duration": 120

    },

    {

      "name": "Test B",

      "status": "failed",

      "error": "Expected value to be 'X', but received 'Y'"

    }

  ]

}
You can generate and view the report in the terminal using this method.
6. JUnit Reporter
The JUnit Reporter generates XML reports that seamlessly integrate with CI/CD tools like Jenkins and GitLab CI for tracking test results. It provides structured test execution data for automated reporting, ensuring efficient monitoring and analysis. This makes it ideal for enterprise testing pipelines, enabling smooth integration and streamlined test management.
npx playwright test --reporter=junit
Navigate to the config.spec.js file and specify the output file, then you can write the XML to a file.
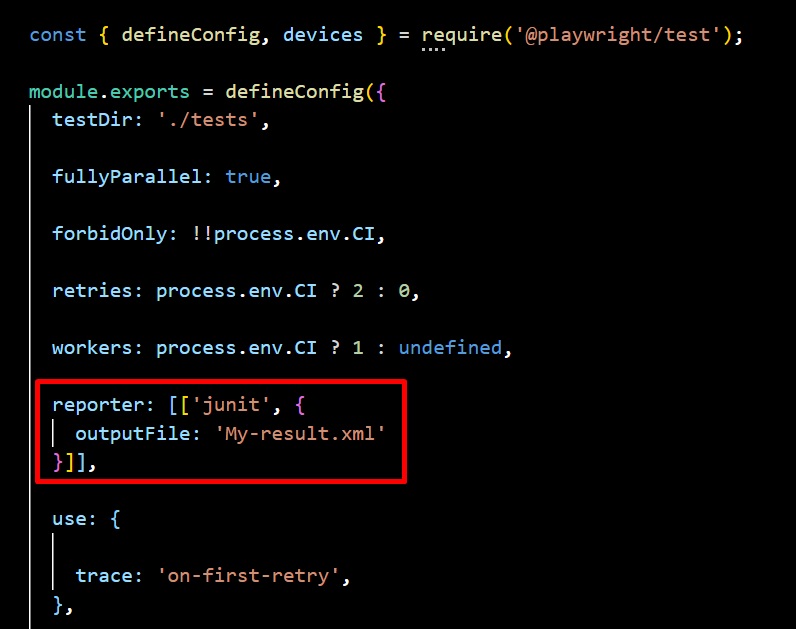
Sample JUnit XML Output:
<testsuite name="Playwright Tests">

  <testcase classname="test1.spec.js" name="Test A" time="0.12"/>

  <testcase classname="test1.spec.js" name="Test B">

    <failure message="Expected value to be 'X', but received 'Y'"/>

  </testcase>

</testsuite>
Playwright’s Third-Party Reports
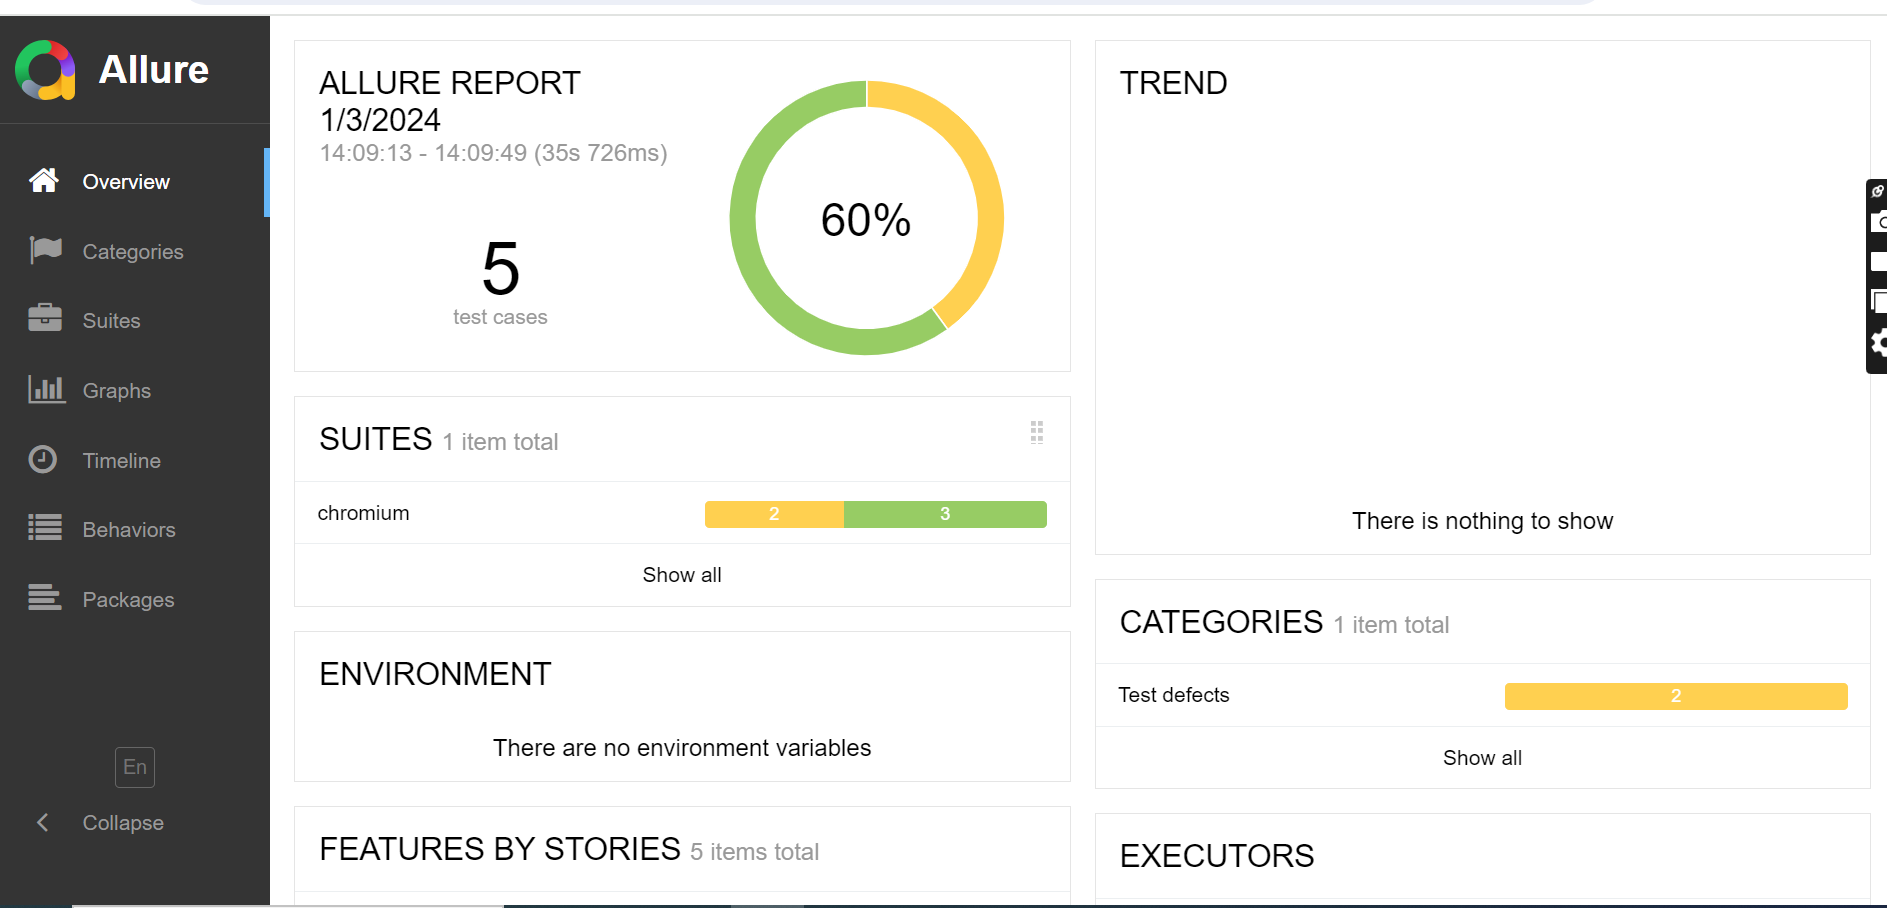
Playwright allows integration with various third-party reporting tools to enhance test result visualization and analysis. These reports provide detailed insights, making debugging and test management more efficient. One such integration is with Allure Report, which offers a comprehensive, interactive, and visually rich test reporting solution. By integrating Allure with Playwright, users can generate detailed HTML-based reports that include test statuses, execution times, logs, screenshots, and graphical representations like pie charts and histograms, improving test analysis and team collaboration.
Allure for Playwright
To generate an Allure report, you need to install the Allure dependency in your project using the following command
npm install allure-playwright --save-dev
Allure Command Line Utility
To view the Allure report in a web browser, you must install the Allure command-line utility as a project dependency
npm install allure-commandline --save-dev
Command Line Execution
You can run Playwright with Allure reporting by specifying the Allure reporter in the configuration and executing the following command:
npx playwright test --reporter=line,allure-playwright
Playwright Config :
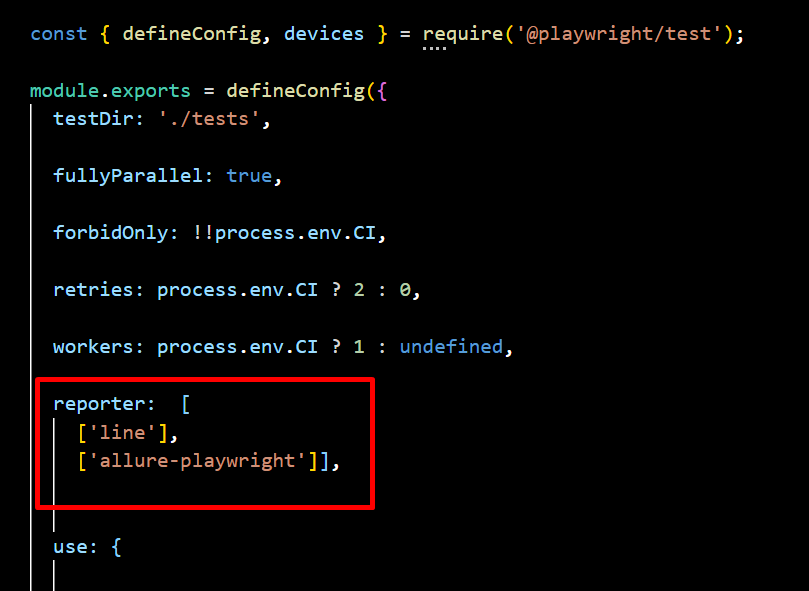
To run Playwright using a predefined configuration file, use the following command:
npx playwright test --config=playwright.allure.config.js
Upon successful execution, this will generate an “allure-results” folder. You then need to use the Allure command line to generate an HTML report:
npx allure generate ./allure-results
If the command executes successfully, it will create an “allure-report” folder. You can open the Allure report in a browser using:
npx allure open ./allure-report
Conclusion
Choosing the right Playwright report depends on your team’s needs. Dot, Line, and List Reporters are perfect for developers who need quick feedback and real-time updates during local testing. If your team needs a more visual approach, the HTML Reporter is great for analyzing results and sharing detailed reports with others. For teams working with CI/CD pipelines, JSON and JUnit Reporters are the best choice as they provide structured data that integrates smoothly with automation tools. If you need deeper insights and visual trends, third-party tools like Allure Report offer advanced analytics and better failure tracking.
Additionally, testing companies like Codoid can help enhance your test reporting by integrating Playwright with custom dashboards and analytics. Your team can improve debugging, collaboration, and software quality by picking the right report.
Frequently Asked Questions
-
Which Playwright reporter is best for debugging?
The HTML Reporter is best for debugging as it provides an interactive web-based report with detailed logs, screenshots, and failure traces. JSON and JUnit Reporters are also useful for storing structured test data for further analysis.
-
Can I customize Playwright reports?
Yes, Playwright allows customization of reports by specifying reporters in the playwright.config.js file. Additionally, JSON and JUnit reports can be processed and visualized using external tools.
-
How does Playwright’s reporting compare to Selenium?
Playwright provides more built-in reporting options than Selenium. While Selenium requires third-party integrations for generating reports, Playwright offers built-in HTML, JSON, and JUnit reports, making test analysis easier without additional plugins.
-
How do I choose the right Playwright reporter for my project?
The best reporter depends on your use case:
For quick debugging → Use List or Line Reporter.
For minimal CI/CD logs → Use Dot Reporter.
For interactive analysis → Use HTML Reporter.
For data processing & automation → Use JSON Reporter.
For CI/CD integration → Use JUnit Reporter.
For advanced visual reporting → Use Allure or Codoid’s reporting solutions.
-
How does Playwright Report compare to Selenium reporting?
Unlike Selenium, which requires third-party libraries for reporting, Playwright has built-in reporting capabilities. Playwright provides HTML, JSON, and JUnit reports natively, making it easier to analyze test results without additional setup.
The post Playwright Reports: The Definitive Guide appeared first on Codoid.
Source: Read More
