This post is the final in a three-part series on leveraging database observability.
Welcome back to our series on Leveraging Database Observability! Our previous post showcased a real-world use case highlighting how MongoDB Atlas’s observability tools effectively tackle database performance challenges. Whether you’re a developer, DBA, or DevOps engineer, our mission is to empower you to harness the full potential of your data through our observability suite.
Integrating Atlas metrics with your central enterprise observability tools can simplify your operations. By seamlessly working with popular observability tools, our approach helps teams streamline workflows and enhance visibility across systems.
Integrating MongoDB Atlas with third-party monitoring tools
MongoDB’s developer data platform combines all essential data services for building modern applications within a unified experience. Our purpose-built observability tools for Atlas environments offer automatic monitoring and optimization, guiding diagnostics tailored specifically for MongoDB. Additionally, we extend Atlas metrics into your existing enterprise observability stack, enabling seamless integration without replacing your current tools. This creates a consolidated, single-pane view that unifies Atlas telemetry with other tech and application metrics, ensuring comprehensive visibility into both database and full-stack performance. This integration empowers you to monitor, receive alerts, and make data-driven decisions within your existing workflows, driving greater efficiency.
Below is a quick guide to modifying integration settings through the Atlas UI and the popular integrations we support:
Navigate to the Project Integrations page in Atlas.
Choose the organization and project you want to configure from the navigation bar.
On the Project Integrations page, select the third-party services you’d like to integrate.
Configure the chosen services with the required API keys and regions.
Critical integrations for your observability platform
With Atlas’s Datadog and Prometheus integrations, you can send critical MongoDB metrics to these platforms, empowering detailed, real-time monitoring. Through Datadog, you can track database operation counts, query efficiency, and resource usage, ideal for pinpointing bottlenecks and managing resources. Similarly, Prometheus enables you to monitor essential metrics like query times, connection rates, and memory usage, supporting flexible tracking of database health and performance. Both integrations facilitate proactive detection of issues, alert configuration for resource thresholds, and a cohesive view of Atlas data when visualized in Grafana.
Atlas’s integration with PagerDuty streamlines incident management by sending metrics like performance alerts, billing anomalies, and security events directly to PagerDuty. This integration records incidents automatically, notifies teams upon alerts, and supports two-way syncing, ensuring resolved alerts in Atlas are reflected in PagerDuty. It enables efficient incident response and resource allocation to maintain system stability.
With Atlas integrations for Microsoft Teams and Slack, you can route key metrics—such as query latency, disk usage, and throughput—to these channels for timely updates. Teams can use these insights for real-time performance monitoring, incident response, and collaboration. Notifications through these platforms ensure your team stays informed on database performance, storage health, and user activity changes as they occur.
Use case: Centralized observability with MongoDB Atlas, Datadog, and Slack
Let’s walk through a hypothetical scenario for ShopSmart, an e-commerce company that leverages MongoDB Atlas to manage its product catalog and customer data. As traffic surges, the DevOps team faces challenges in monitoring application performance and database health effectively.
To tackle these challenges, the team leverages MongoDB Atlas’ integration with Datadog and Slack, creating a powerful observability ecosystem.
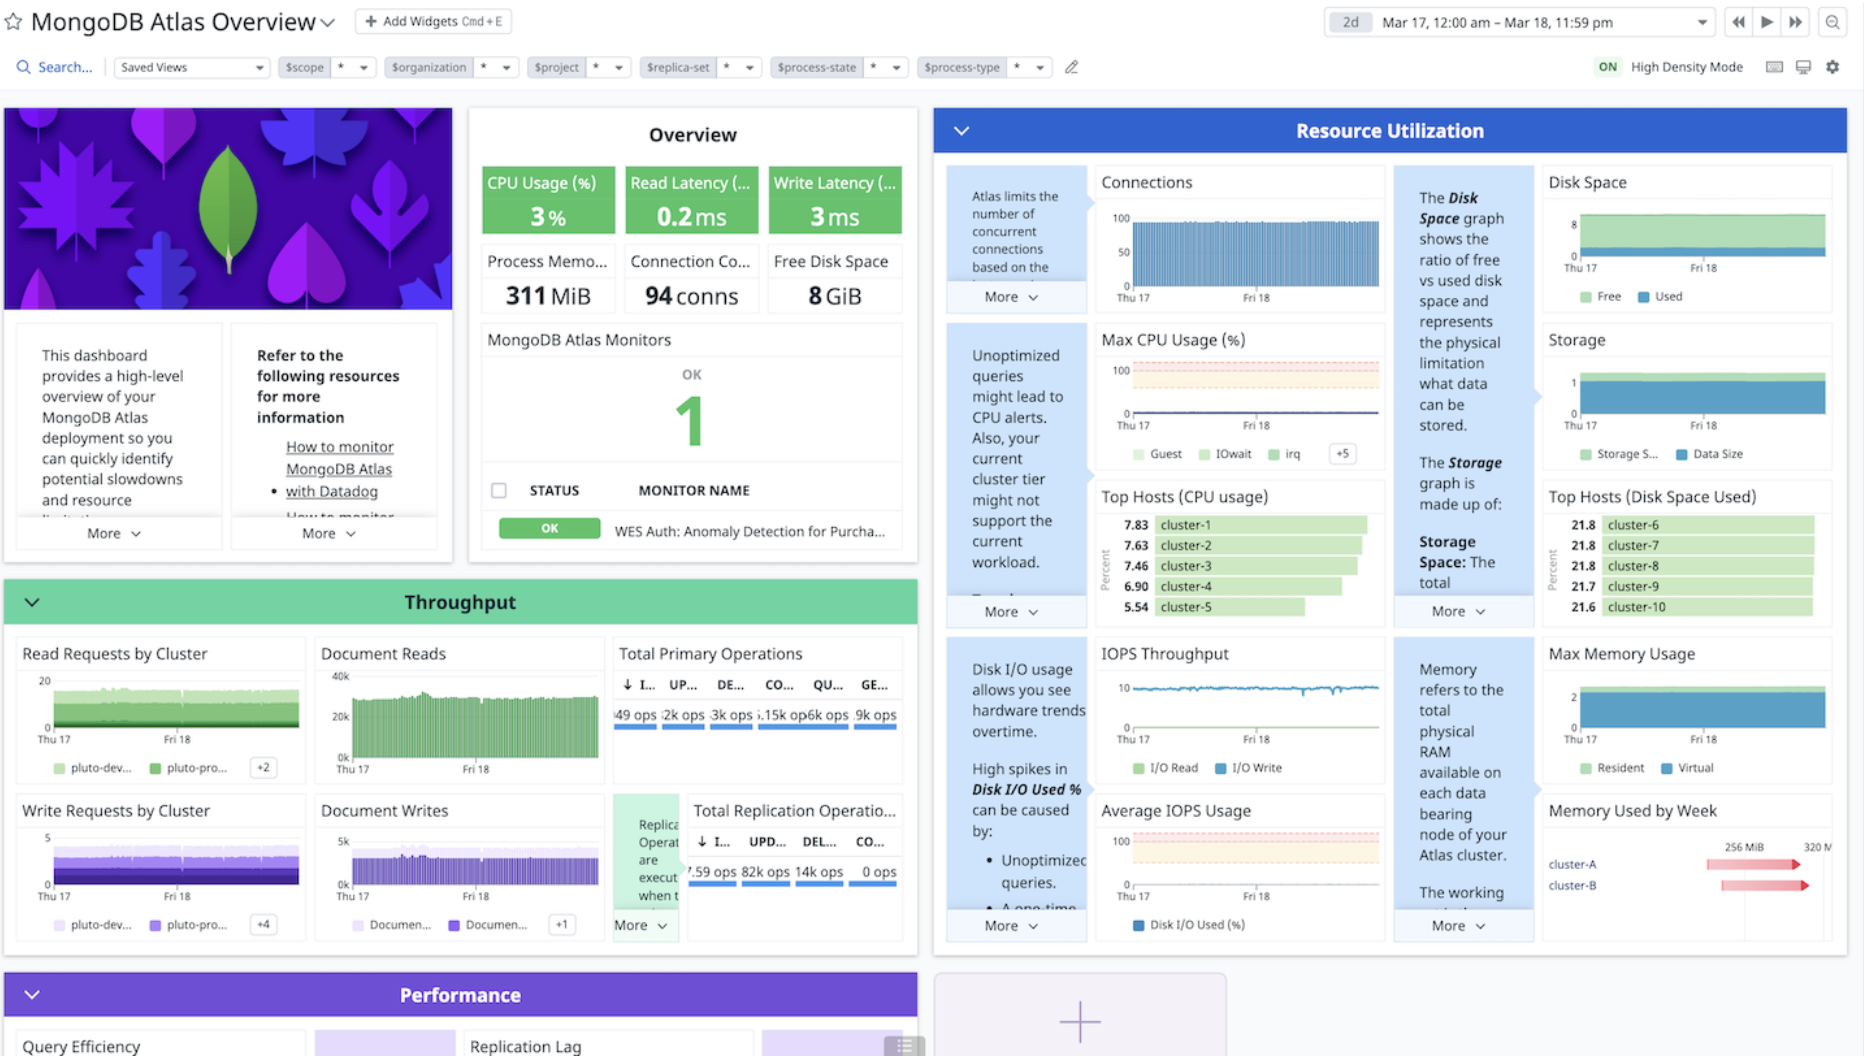
- Integrating MongoDB Atlas with Datadog: The team pushes key MongoDB Atlas metrics into Datadog, such as query performance, connection counts, and Atlas Vector Search metrics. With Datadog, they can visualize these metrics and correlate overall MongoDB performance with their other applications. Out-of-the-box monitors and dedicated dashboards allow the team to track metrics like throughput, average read/write latency, and current connections. This visibility helps pinpoint bottlenecks in real time, ensuring optimal database performance and improving overall application responsiveness.
- Setting up alerts in Datadog: The team configures alerts for critical metrics like high query latency and increased error rates. When thresholds are breached, Datadog instantly notifies the team. This proactive approach allows the team to address potential performance issues before they impact customers.
- Integrating Datadog with Slack: To ensure fast communication, alerts are sent directly to the dedicated Slack channel, “ShopSmart-Alerts.†This integration fosters seamless collaboration, enabling the team to discuss and resolve issues in real-time.
With these integrations, ShopSmart’s engineering team can monitor performance quickly and address issues efficiently. The unified observability approach enhances operational efficiency, improves the customer experience, and supports ShopSmart’s competitive edge in the e-commerce industry. By leveraging MongoDB Atlas, Datadog, and Slack, the team ensures scalable performance and drives continuous innovation.
Conclusion
MongoDB Atlas empowers developers and organizations to achieve unparalleled observability and control over their database environments. By seamlessly integrating with central enterprise observability tools, Atlas enhances your ability to monitor performance metrics and ensures you can do so within your existing workflows. This means you can focus on building modern applications confidently, knowing you have the insights and alerts necessary to maintain optimal performance. Embrace the power of MongoDB Atlas and transform your approach to database management—because your applications can thrive when your data is observable.
And that wraps up our Leveraging Database Observability series! We hope you learned something new and found value in these discussions.
Sign up for MongoDB Atlas, our cloud database service, to see database observability in action. To dive deeper and expand your knowledge, check out this learning byte for more insights on the MongoDB observability suite and how it can enhance your database performance.
Source: Read More

