In the era of information, data analysis is one of the most powerful tools for any business providing them with insights about market trends, customer behavior, and operational inefficiencies. Despite the large requirements in the field, skilled data analytics are limited, creating a significant gap between the potential value of data and the ability to extract it effectively.Â
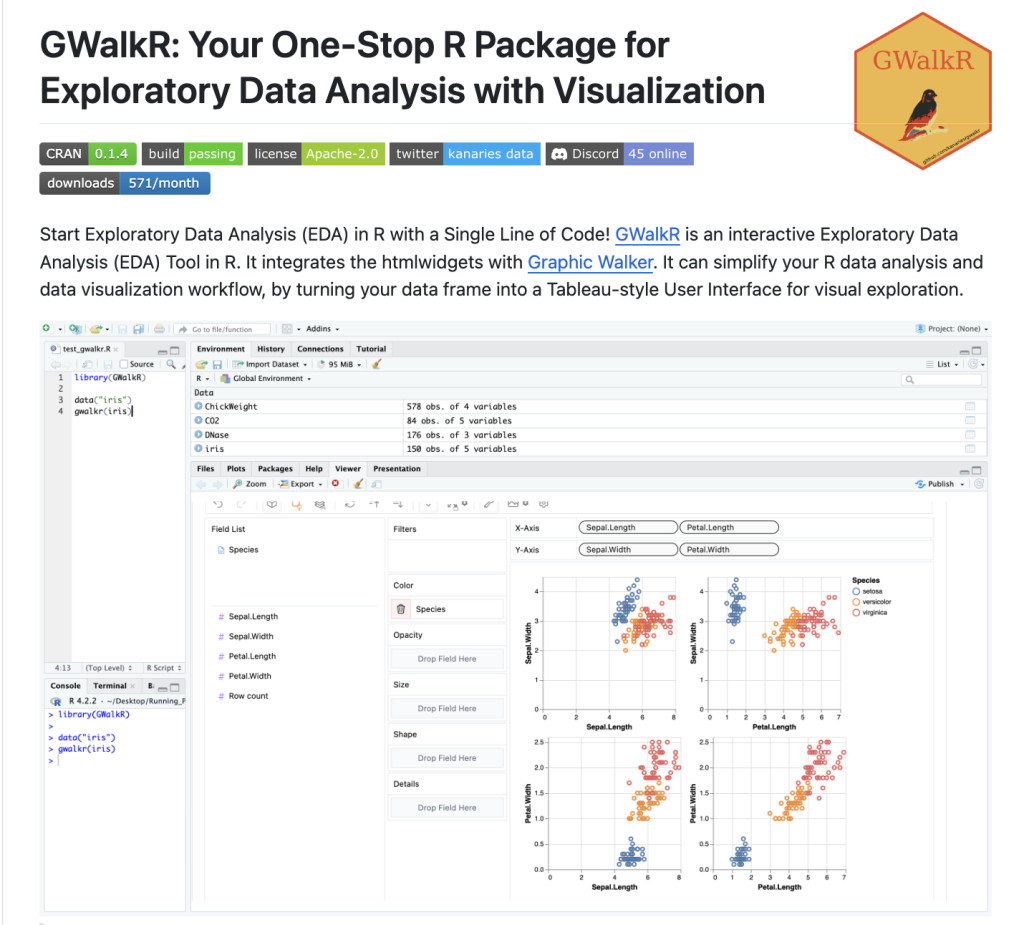
A recently released R package, GWalkR addresses the challenge of democratizing data analysis and making complex information accessible to a wider audience. The initial exploratory phase of data projects often requires extensive R programming for data manipulation and visualization, a process that can be both time-consuming and error-prone. Moreover, it necessitates a high level of programming expertise, which can be a barrier for many analysts. GWalkR aims to streamline this process, providing a user-friendly interface that simplifies data exploration without the need for complex coding.
Traditionally, exploratory data analysis in R involves writing extensive code to manipulate and visualize data. This can be a complex and inefficient process, especially for users who are not experts in programming. Existing tools like ggplot2 and dplyr require a deep understanding of R syntax and principles. GWalkR proposes an innovative solution to this problem by offering an interactive, drag-and-drop interface for data exploration. This interface is inspired by popular visualization tools like Tableau known for their ease of use and accessibility.
GWalkR builds upon R’s robust data manipulation and visualization capabilities but presents them in a user-friendly format. Key components of GWalkR include data ingestion, data transformation, visualization, interactivity, and integration with Shiny. It supports various data formats, offers basic data cleaning and manipulation functions, and provides a rich set of visualization options such as bar charts, scatter plots, and histograms. The tool’s interactivity allows users to dynamically explore data through features like filters, zooming, and panning. Additionally, its integration with Shiny enables users to create interactive web applications based on GWalkR visualizations. In terms of performance, GWalkR is generally efficient for medium-sized datasets which may vary with larger datasets depending on the complexity of the visualizations and available hardware resources.
In conclusion, GWalkR represents a significant advancement in the field of exploratory data analysis by simplifying the process and making it accessible to a broader audience. By reducing the reliance on complex R programming, it empowers users to focus more on deriving insights and making informed decisions. GWalkR’s user-friendly interface, coupled with its robust functionality and integration with the R ecosystem, makes it a valuable addition to the toolkit of data analysts and scientists.
The post GWalkR: A One-Stop R Package for Exploratory Data Analysis with Visualization appeared first on MarkTechPost.
Source: Read MoreÂ


