The console object is the number one go-to for developers when working with buggy JavaScript code.
But if you still rely heavily on the console object alone to debug your JavaScript, then you’re missing out on some amazing browser developer tools features.
Let’s take a look at how you can debug JavaScript with the Chrome developer tools.
The Buggy Code We’re Working With
To get started, I’ve prepared some buggy code that should add four numbers and also get their average.
Here’s the HTML of the code:
<label for="num1">Number 1:</label>
<input type="text" id="num1" placeholder="Enter a number" />

<label for="num2">Number 2:</label>
<input type="text" id="num2" placeholder="Enter a number" />

<label for="num3">Number 3:</label>
<input type="text" id="num3" placeholder="Enter a number" />

<label for="num4">Number 4:</label>
<input type="text" id="num4" placeholder="Enter a number" />

<button id="calculateBtn">Calculate Sum and Average</button>

<p id="addition-result"></p>
<p id="average-result"></p>

<script src="script.js"></script>
Here’s the very minimal CSS to push the labels to their respective lines and enlarge the input elements and button a bit:
body {
  background: #d2d2d2;
}

label {
  display: block;
  margin-top: 0.5rem;
}

button {
  display: block;
  margin-top: 1rem;
}

input,
button {
  padding: 0.2rem;
}
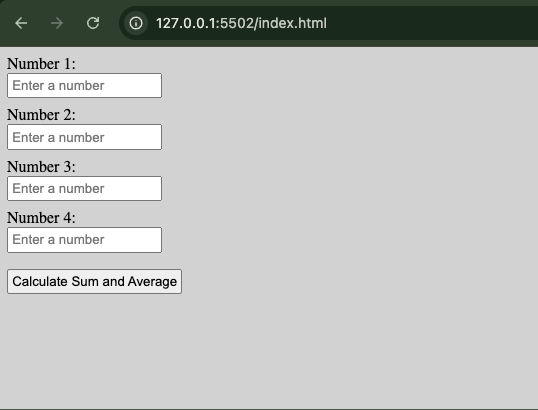
Here’s what the HTML and CSS displays in the browser:
And here’s the JavaScript in which the bug occurs:
const calculateBtn = document.getElementById('calculateBtn');
const sumText = document.getElementById('sum');
const avgText = document.getElementById('average');

function calculateTotal(a, b, c, d) {
 return a + b + c + d;
}

function calculateAverage(total, count) {
 return total / count;
}

function handleButtonClick() {
 let num1 = document.getElementById('num1').value;
 let num2 = document.getElementById('num2').value;
 let num3 = document.getElementById('num3').value;
 let num4 = document.getElementById('num4').value;

 let total = calculateTotal(num1, num2, num3, num4);
 let average = calculateAverage(total, 4);

 sumText.textContent = `The sum is ${total}`;
 avgText.textContent = `The average is: ${average}`;
}

calculateBtn.addEventListener('click', handleButtonClick);
Here’s what happens if you enter the 4 numbers, say 3, 4, 2, 1, and click the Calculate Sum and Average button:
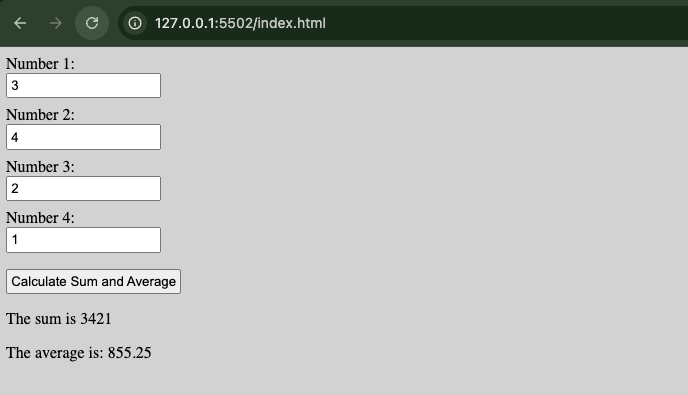
Unfortunately, the numbers just got merged and the average is calculated based on that, which means concatenation is going on instead of addition. The buggy addition leads to a buggy average calculation too.
Let’s investigate what’s happening with the browser developer tools.
How to Debug JavaScript Code Using Chrome Developer Tools
When such a bug occurs, you might be tempted to add a bunch of console logs.
Many times, console logs get the job done – but you have to spend a lot of time figuring things out.
The browser developer tools give you more options such as adding breakpoints, watching particular expressions, and even stepping through the code line by line to see where the bug occurs.
How to Open the Developer Tools and the Sources Tab
To start, right-click in the browser and select “inspect” to open the Chrome DevTools.
While in DevTools, head over to the “Sources” tab to see the files in the program. You can also press F12 on your keyboard and select the Sources tab.
Here’s a brief anatomy of the Chrome DevTools Sources tab:
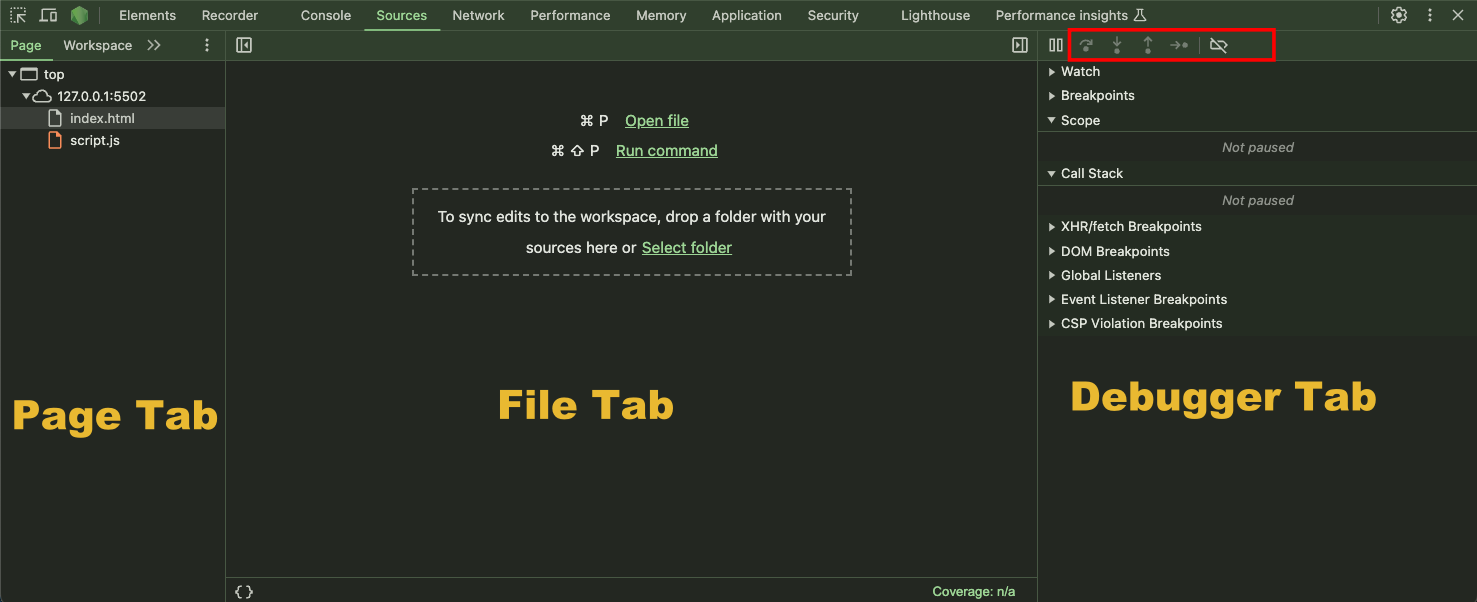
On top of the debugger tab are some greyed-out icons. When active, they let you step through your code and add or remove breakpoints.
Also in the debugger tab are:
-
Watch: where you can add and see the watch expressions
-
Breakpoints: where you can see the code of the line you add a breakpoint to
-
Scope: contains the local and global variables
-
Callstack: shows the function calls that lead to the current point of code execution
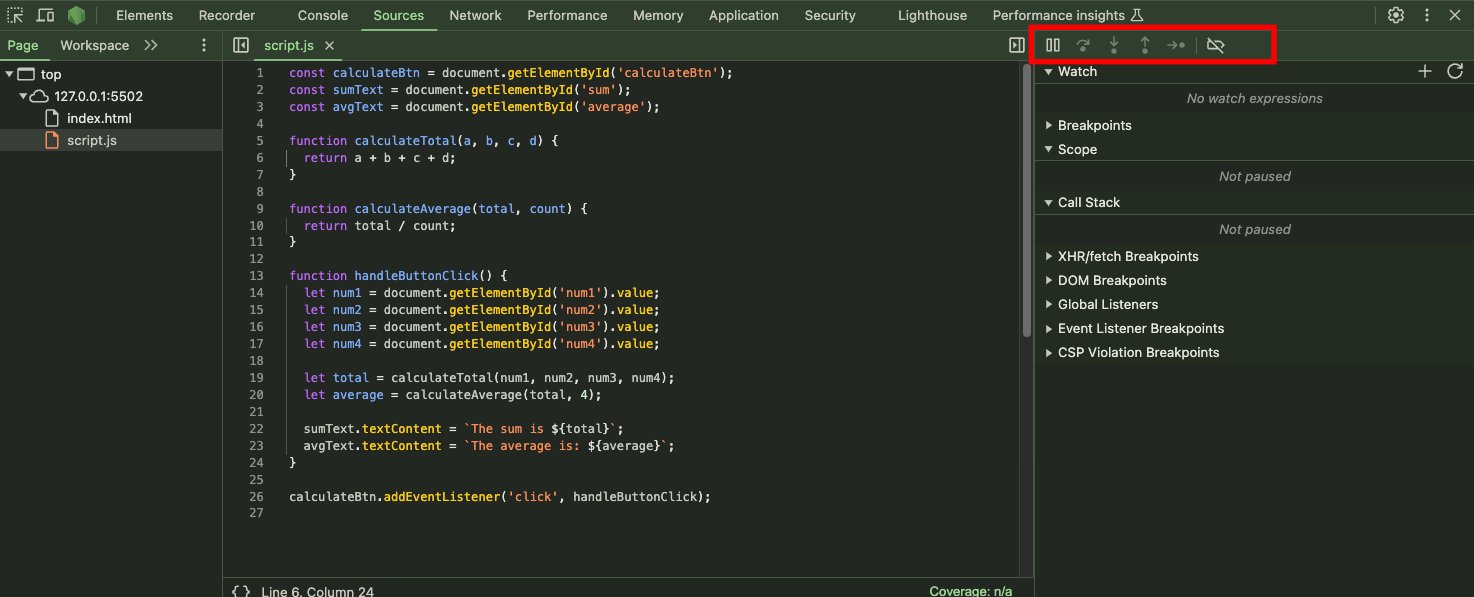
To see the contents of any file, you can click on it. After doing that, some of the icons in the debugger tab won’t be greyed out anymore.
How to Debug the Code by Adding Breakpoints
To start debugging the code, you can add a breakpoint to a line by clicking the line number.
A breakpoint is like a line marker you can set in the developer tools to pause the execution of your code before that line executes. This lets you check variable values, see if functions are called as expected, or observe the general flow of the code.
When you add a breakpoint and execute the code, a bluish icon appears on that line, indicating that execution will pause before that line.
Alternatively, you can add the debugger statement to the line where you want the execution to be paused. But let’s stick to using breakpoints.
For example, let’s add a breakpoint to line 14, then enter the four numbers and click the Calculate Sum and Average button so the code will run:
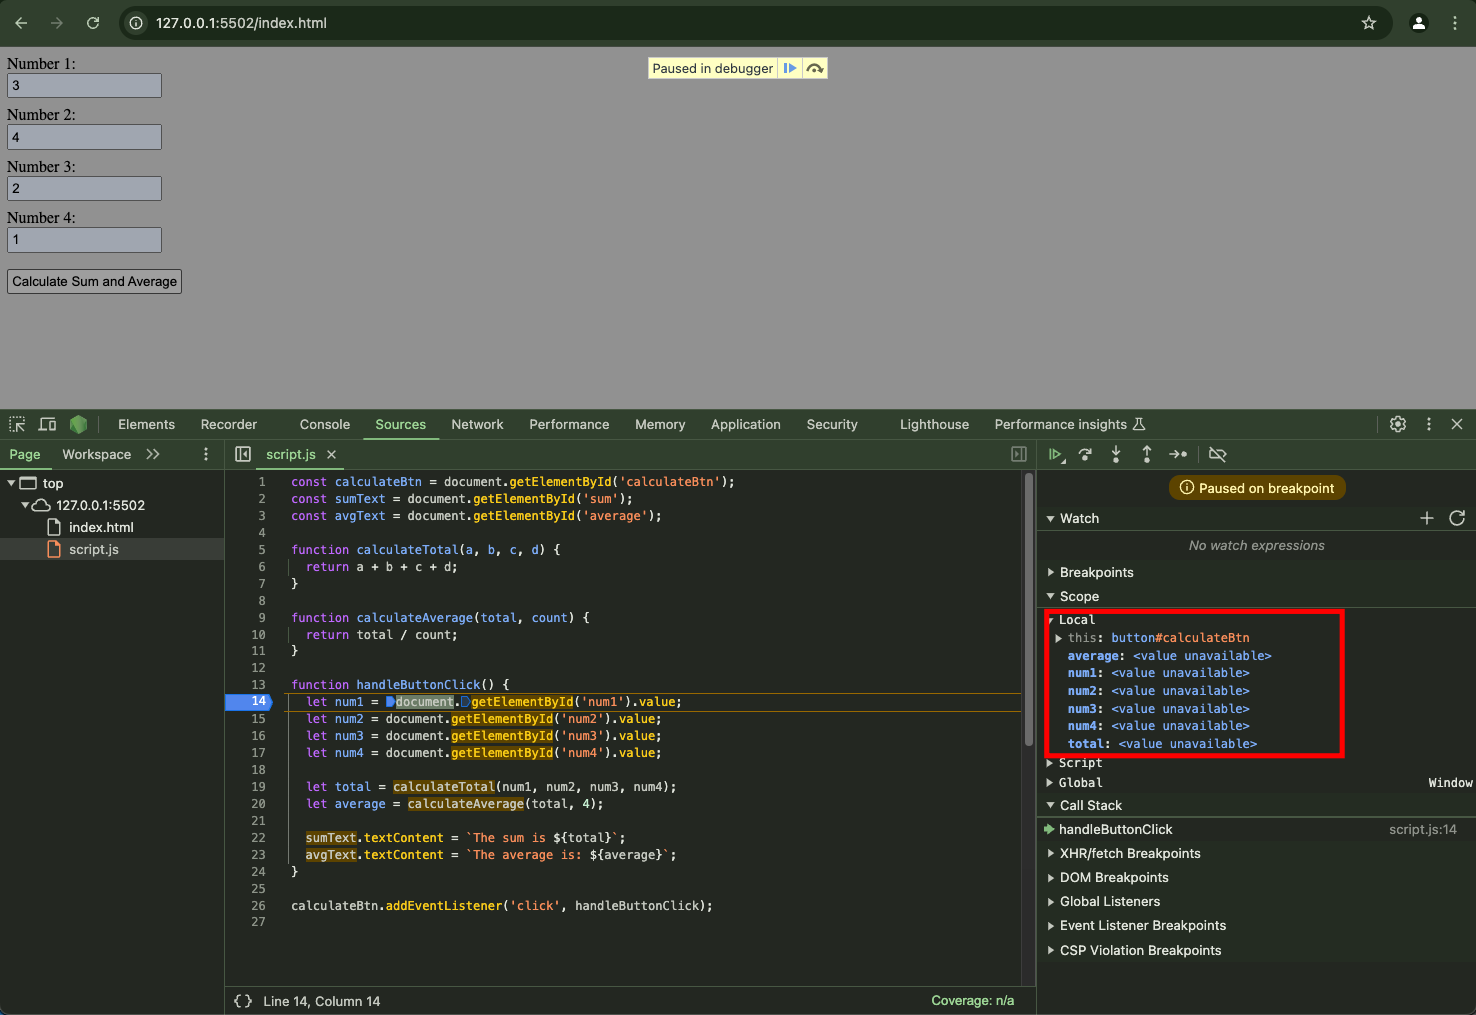
At this point, you can see that the execution did not continue – that’s why you see “value unavailable” for all the variables under “Localâ€.
From here, you can start stepping through the code line by line by pressing the step icon in the top right corner:
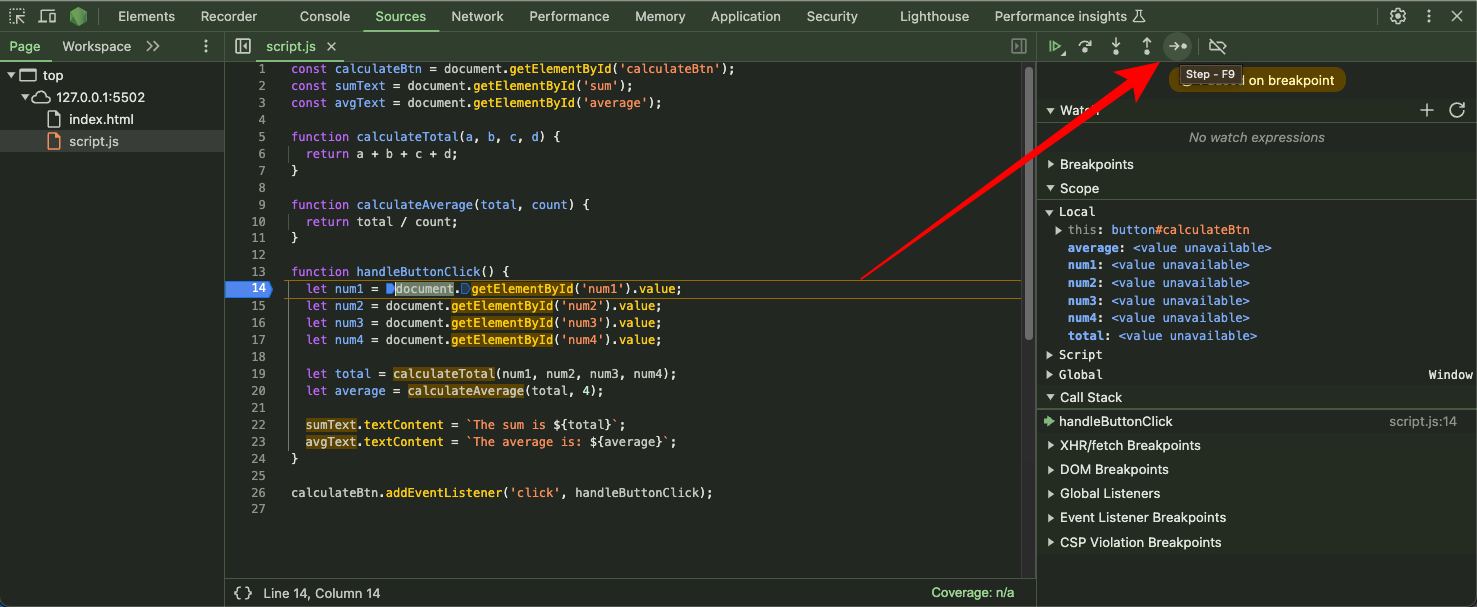
Once you click the step icon, the line you step out of executes.
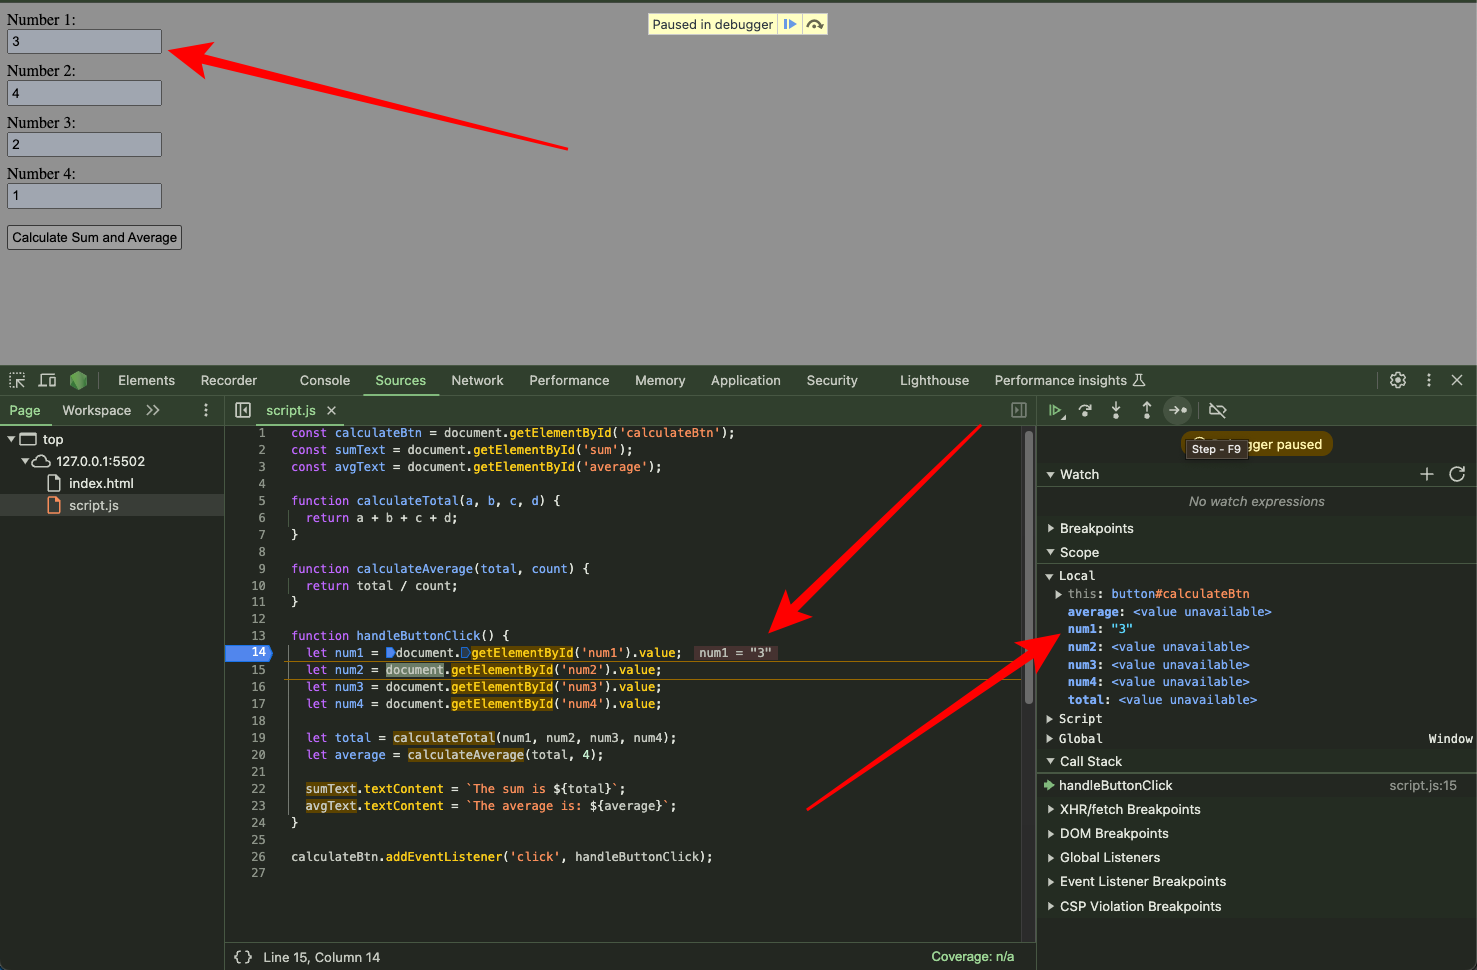
You can see that "3" is the value for line 14. That value is surrounded by a pair of double quotes. That means it‘s a string. You need to be sure about that, though, and that’s what the watch feature lets you do. You’ll learn about that feature soon.
If you’re working with several lines of code, it might be time-consuming to step through the code line by line. So, you might have to add another breakpoint.
I will go ahead and set a breakpoint at line 23 and run the code again:
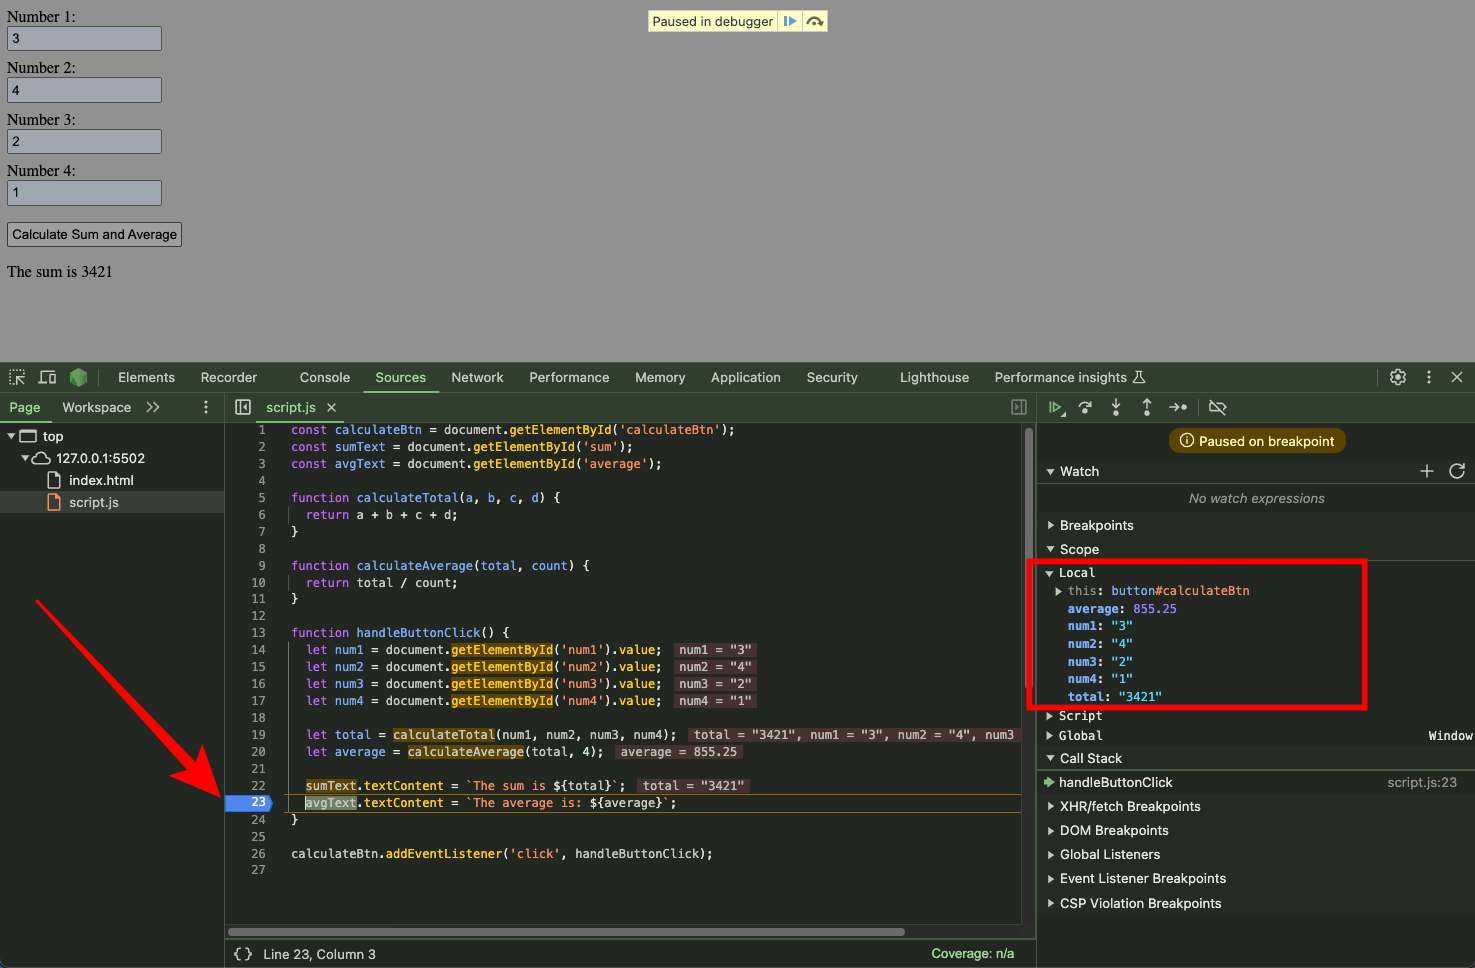
Now you can see that all the variable results apart from average appear to be strings. This takes us to the next Chrome developer tools debugger feature – watcher.
How to Use the Developer Tools Watch Feature
The developer tools watch feature lets you monitor specific variables or expressions as your code runs.
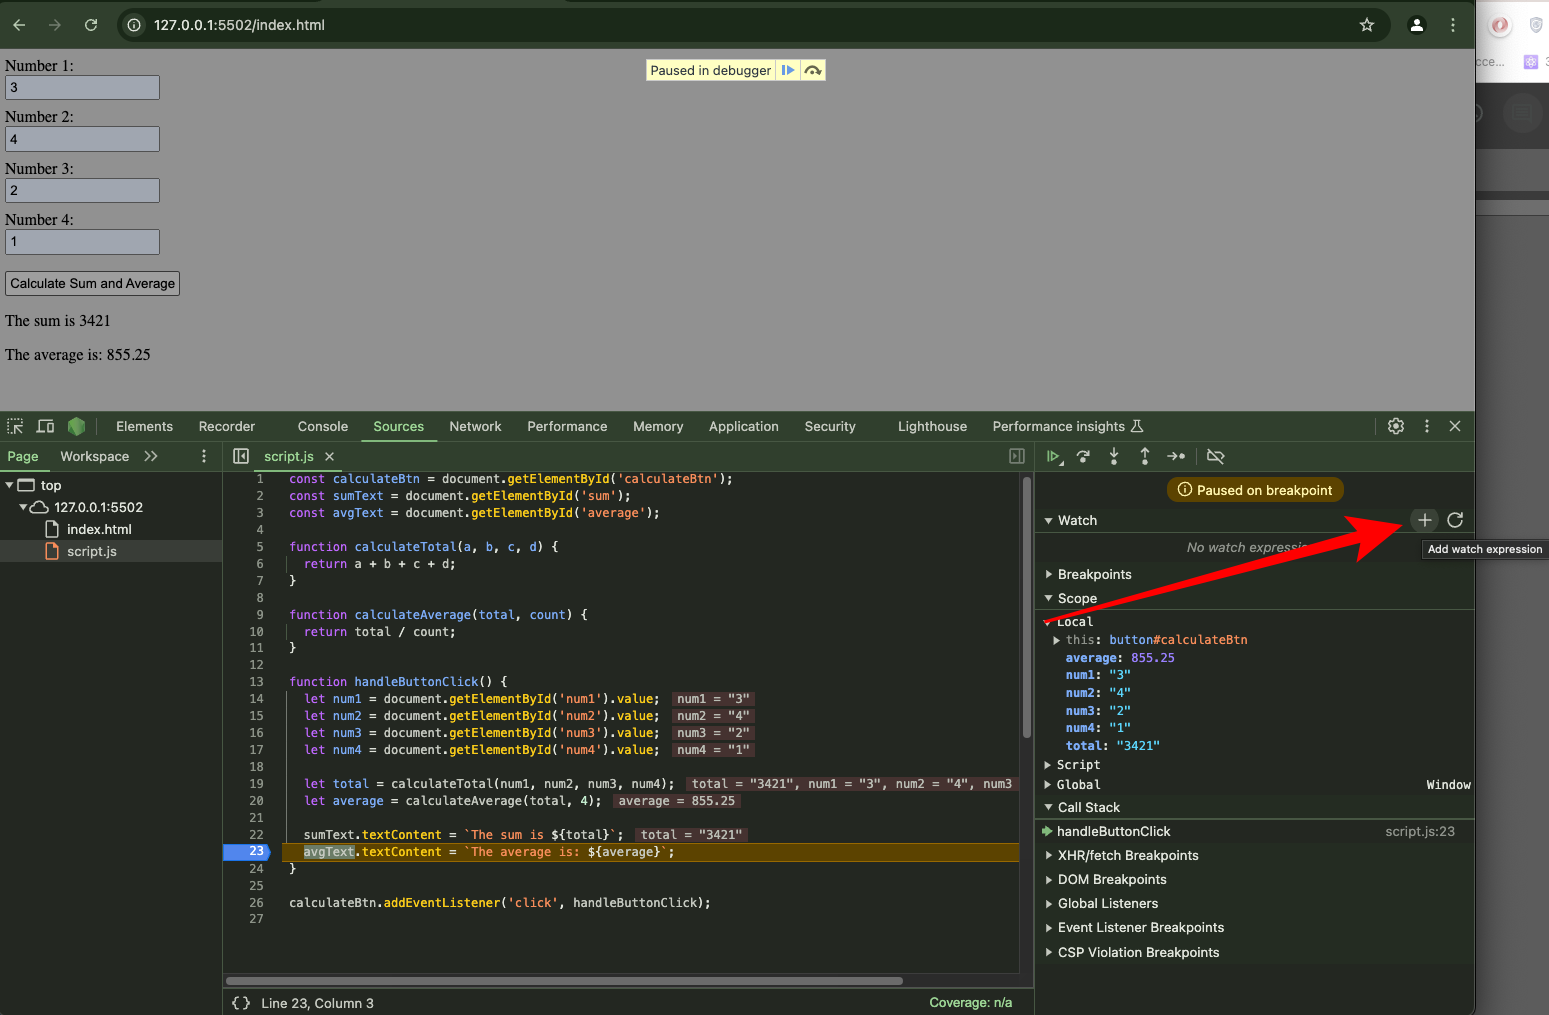
To confirm the data type of the variables, you can add a watch expression that shows their values, or more appropriately, their types.
To add a watch expression, click the plus (+) icon right beside “Watch†and hit ENTER on your keyboard.
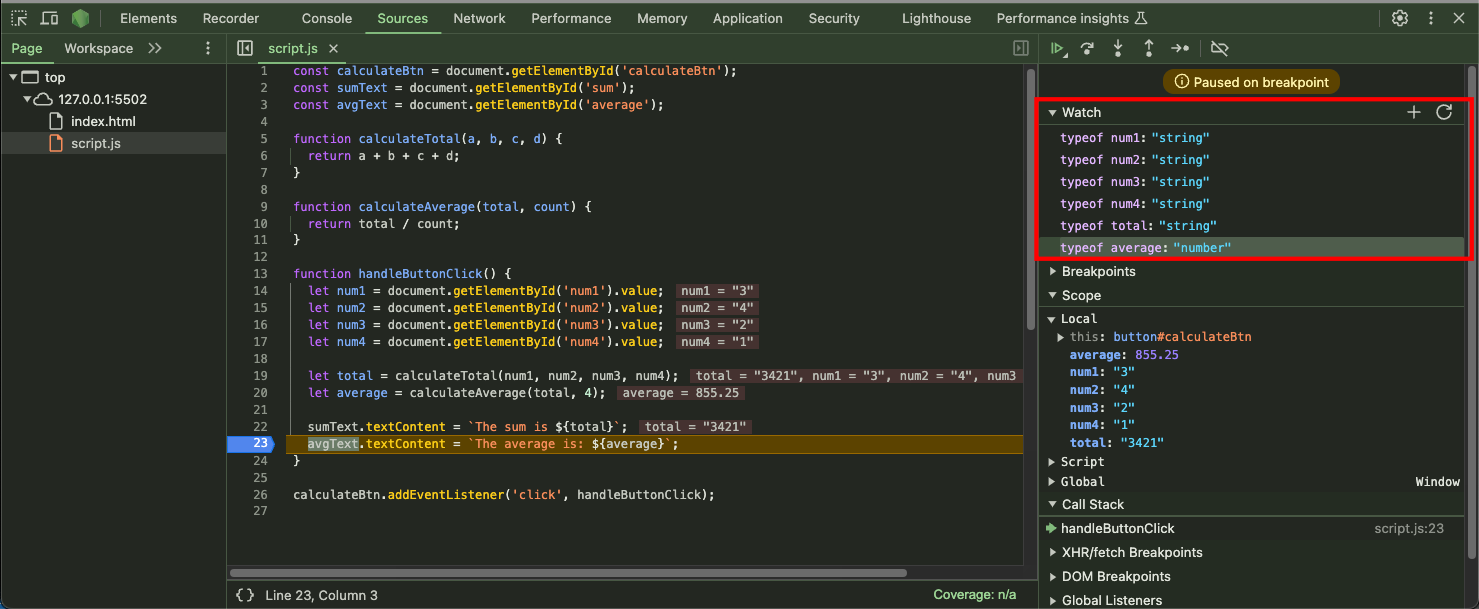
Here are the watch expressions that confirm that num1 through num4 and total are strings – but they should be integers:
You can also verify this in the console tab by checking the types of the variables there:
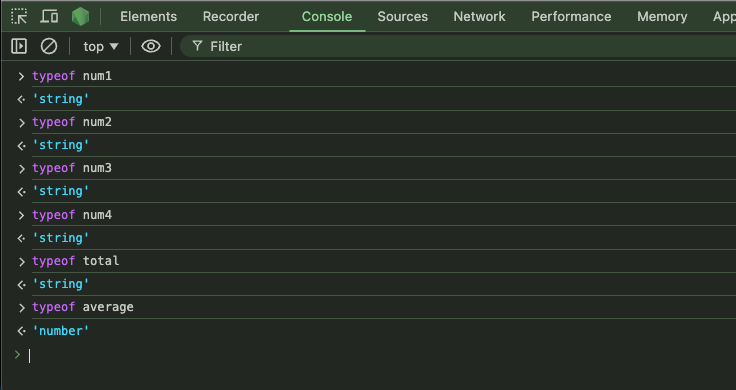
This means that the numbers you enter are interpreted as strings. That’s because, in JavaScript, values from HTML elements like input fields are always retrieved as strings.
This happens because the value property of an input element returns a string, regardless of whether you enter numbers – and that’s how the bug was introduced.
Remember that JavaScript only concatenates strings even if they’re numbers. That means "3" is a string type and not an integer type.
To fix the bug, you should change the types of num1 through num4 to integers so JavaScript can correctly sum up their values.
You can then go ahead and fix this in the DevTools and press CTRL + S on Windows or CMD + S on Mac to save the code. You can also fix it inside your code editor by wrapping the variables of the numbers in parseInt().
Once you do that and run the code again, the correct data types should show in the watcher, and the correct variable values should show under Local:
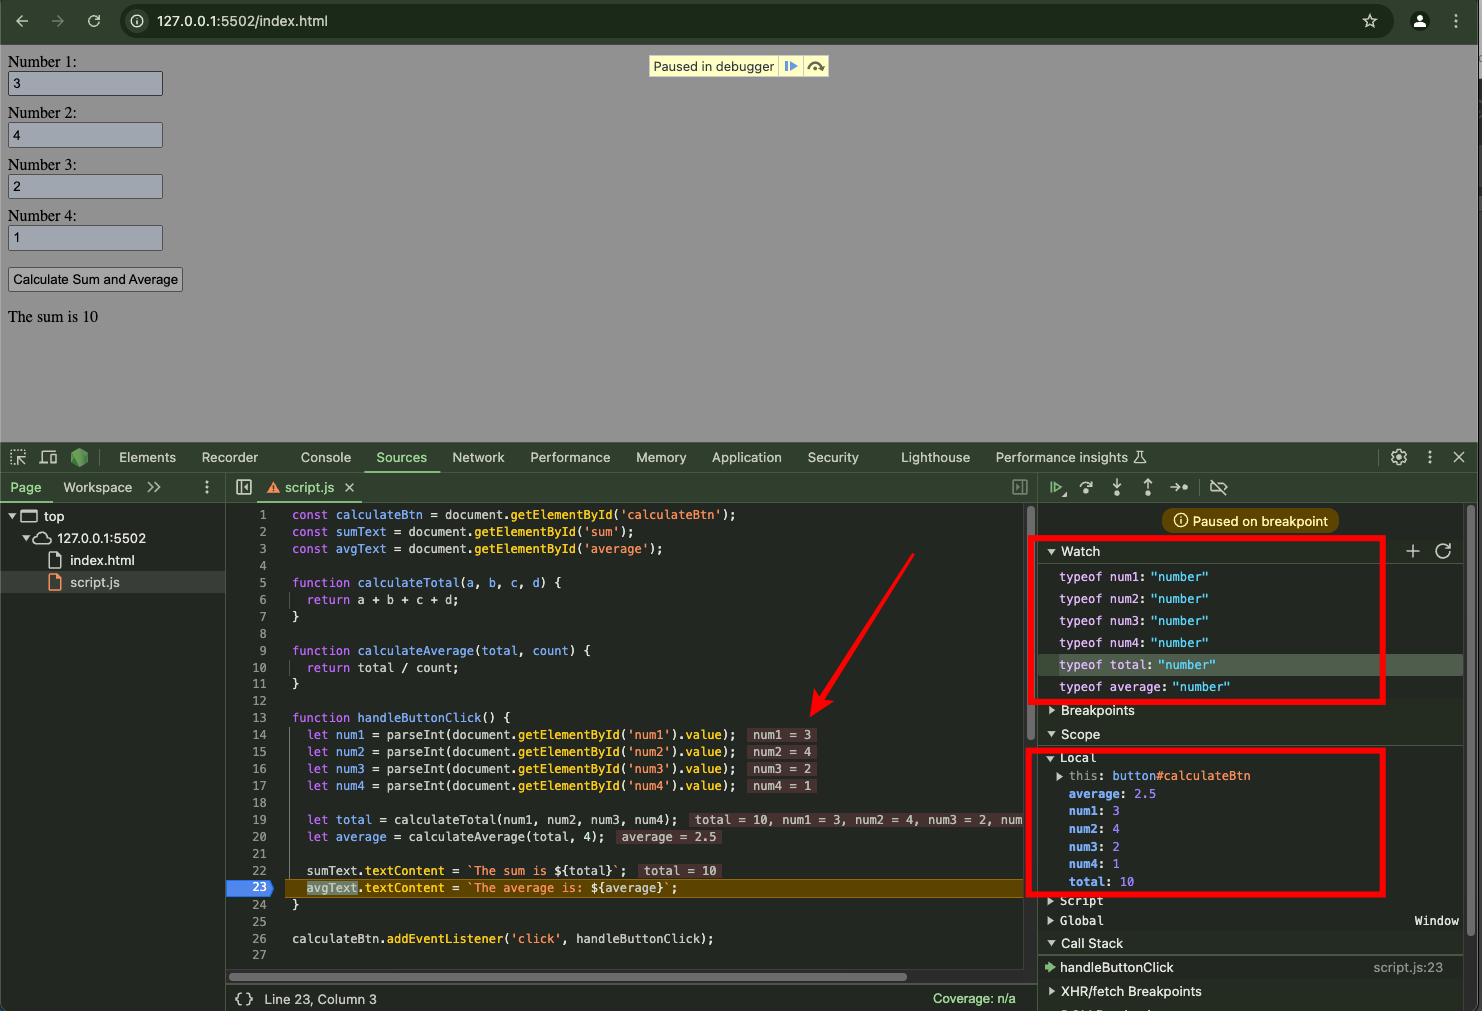
You can also go ahead and implement the changes in your code editor so that everything works. Here’s the correct code:
const calculateBtn = document.getElementById('calculateBtn');
const sumText = document.getElementById('sum');
const avgText = document.getElementById('average');

function calculateTotal(a, b, c, d) {
  return a + b + c + d;
}

function calculateAverage(total, count) {
  return total / count;
}

function handleButtonClick() {
  let num1 = parseInt(document.getElementById('num1').value);
  let num2 = parseInt(document.getElementById('num2').value);
  let num3 = parseInt(document.getElementById('num3').value);
  let num4 = parseInt(document.getElementById('num4').value);

  let total = calculateTotal(num1, num2, num3, num4);
  let average = calculateAverage(total, 4);

  sumText.textContent = `The sum is ${total}`;
  avgText.textContent = `The average is: ${average}`;
}

calculateBtn.addEventListener('click', handleButtonClick);
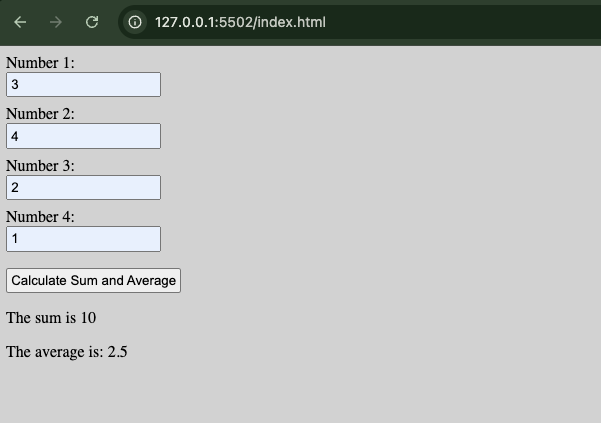
And here’s the result in the browser:
Conclusion
That’s how you can debug JavaScript using Chrome’s developer tools. The breakpoint and watcher features, alongside the step-through buttons, are upgrades over a basic console log.
Note that every modern browser has this JavaScript debugging tool built into it, so you can use the same approach to debug JavaScript with Firefox or Edge.
Source: freeCodeCamp Programming Tutorials: Python, JavaScript, Git & MoreÂ


